Beyond governments, American society has always depended on a wide array of civic institutions to provide critical information to constituents, hold governments accountable, and support families and workers to be healthy, educated, and productive. This section examines civic institutions–and whether they are fair, effective, and healthy.
This issue of Pandemic to Prosperity examines the ability of people to access information they need to make informed decisions during a pandemic. We examine local news and internet access to assess communities’ ability to receive critical information and remain connected in a world that is dramatically more digital than just a few months ago. We also examine changes in college enrollment and health insurance availability by race and ethnicity.
Indicators in this section
- Counties with no or only one newspaper with high Covid rates
- Internet access by race
- Undergraduate and graduate student enrollment change by race/ethnicity
- Health insurance coverage by race
More than half of counties experiencing high rates of new cases of Covid are in news deserts, meaning a critical vehicle for trusted information during the pandemic is absent.
Counties with no or only one newspaper (often only a weekly) that also have high Covid rates
News deserts as of 2020, Covid cases as of Oct 19, 2020
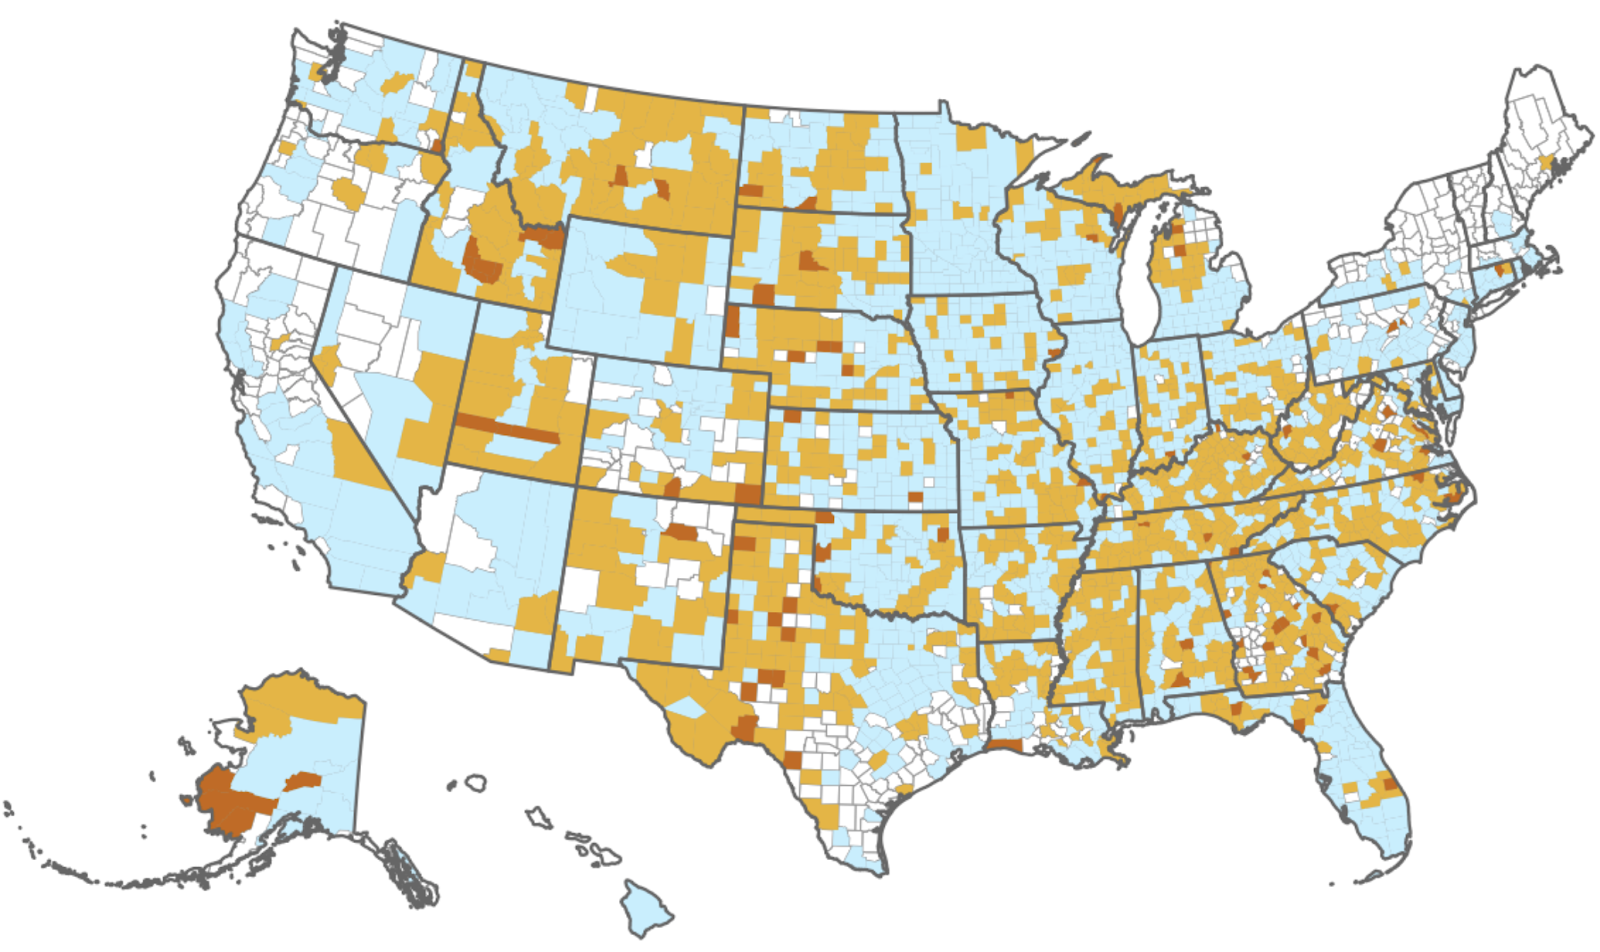
Source: UNC Hussman School of Journalism and Media; New York Times Covid-19 data; inspired by Brookings research
Note: Counties with ≥50 cases/100k people in the past week are classified as “high rate” of new cases for this analysis. Blank counties on the map have Covid rates below threshold.
Trusted local news sources are key to the success of public health campaigns, holding local governments accountable, and for getting word out about Covid outbreaks attributed to contact at local bars, workplaces, group quarters, and weddings.1 Local newspapers are also vehicles for sharing inspirational stories that connect readers to resources. In late September, for example, The Indianapolis Star published “’We move the economy’: How Latino-owned businesses are meeting unique challenges.” The article detailed how the nonprofit sector is retooling to help Latinx business owners navigate the resources available to help them survive the pandemic.2,3
When the Covid rate passes 50 new cases per 100k a week, communities are considered to be on the brink of runaway infection rates, if public health measures are not rapidly implemented and followed.4 More than half of counties that are above that pandemic threshold are also in what experts describe as “local news deserts” that have either no newspaper or only one (often a weekly or a thinly staffed daily).5
The news desert situation is getting worse with the pandemic, with Poynter research identifying 50 closures of local newsrooms due to the Covid crisis.6
Nearly 1 in 4 Indigenous People and Alaska Natives are without a computer or internet access, a gap more than twice as large as that of white and Asian people.
Internet access by race, 2019
Percent of racial groups without a computer, or without broadband or dial-up internet access
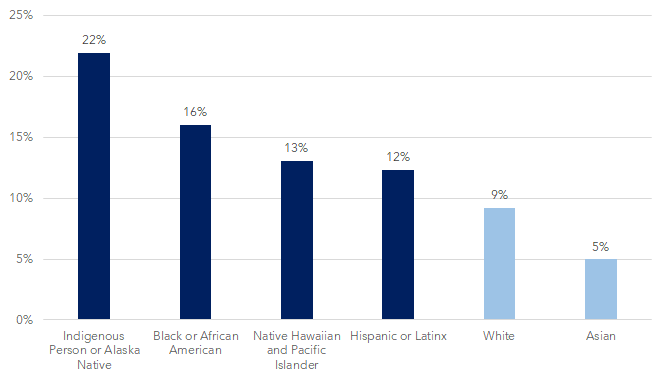
Source: United States Census Bureau
Internet access is a strong indicator of racial inequity in the United States. According to the Census Bureau’s American Community Survey, there is a 17 percentage point difference between the group with the greatest access to the internet and the group with the least access. Nearly 1 in 4 Indigenous People and Alaska Natives do not have either a computer or access to the internet, compared to only 9% of white people and 5% of Asian people.
Lack of access to the internet has especially harmful consequences during the pandemic, as it limits access to telehealth, education, news, and communication with the outside world. Reliance on the internet for education has become paramount this year, and those without access are at risk of falling behind.1 The wide disparity in access to the internet highlights another basic need that is not being met for many Americans.
Graduate enrollment is up almost 3% compared to Fall 2019, while undergraduate enrollment is down 4% – driven primarily by a downturn in first-time undergraduate students.
Fall 2020 enrollment changes compared to same time last year by race/ethnicity
54 percent of colleges reporting as of September 24, 2020
 Source: National Student Clearinghouse Source: National Student ClearinghouseUndergraduate enrollment dropped significantly this fall, with decreases across all racial/enthnic groups. Indigenous and international students experienced the largest declines. And among college types, community colleges were particularly hard hit with declining enrollments. The decrease in enrollment was most sharp among freshman students who may be opting to delay college at a time when many colleges may only be offering online instruction.1 This is in contrast to trends during previous recessions when college enrollment increased as young people opted for education when job opportunities were thin.2 At the same time, graduate enrollment increased 2.7% according to data compiled as of September 24, with Hispanic, Black, and Asian students experiencing the greatest increases. Only international students have declined in graduate school enrollment. While the increase in graduate enrollment is less than recent years, not all schools have yet reported. |
The share of adults without health insurance, which has decreased since the Affordable Care Act implementation, has crept up among Hispanic or Latinx, Native Hawaiian and Pacific Islander, white, and Asian adults in recent years.
Lack of health insurance coverage by race/ethnicity
Population age 18-64 with no health insurance coverage by race/ethnicity
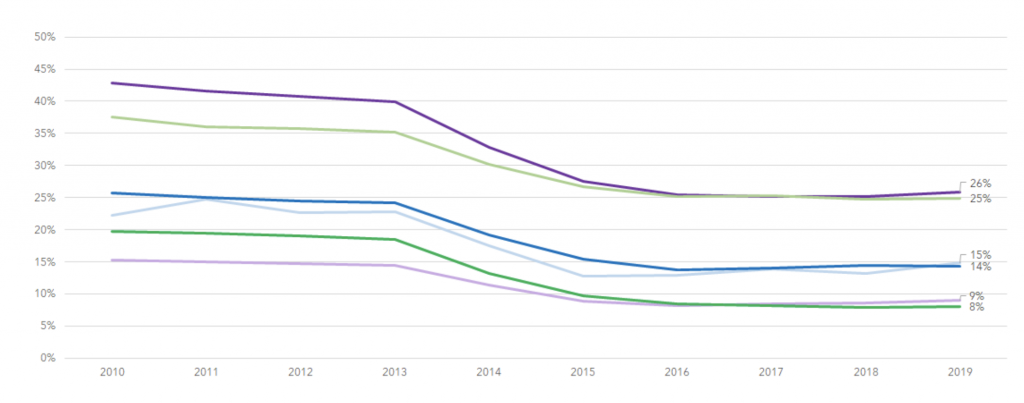
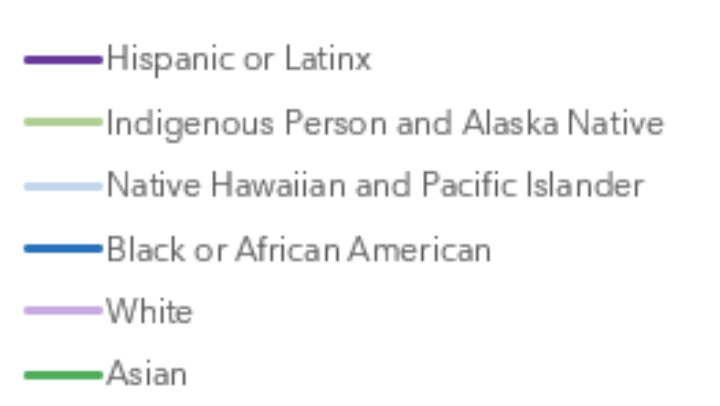
Source: Census Bureau’s American Community Survey
Health insurance increases access to necessary health care for individuals, both during times of illness, and in the form of preventative care.1,2 A lack of health insurance coverage can lead to untreated illness or injury3. Those without health insurance increase societal costs through expensive emergency room visits and lost worker productivity2. Examining health insurance coverage for individuals 18–64 years old is particularly important because those under 18 and above 64 are eligible for other forms of health insurance that lead to higher rates of coverage4.Since 2010, rates of the uninsured have dramatically dropped with the implementation of the Affordable Care Act (ACA). Because states varied as to when they rolled-out certain aspects of the ACA, such as the expansion of Medicaid, there was a gradual decrease in the number of uninsured between 2010 and 2019. During this time frame, White and Asian populations had the lowest rates of uninsured adults, while Hispanic or Latinx and Indigenous People or Alaska Natives have the highest rates of uninsured adults. Currently, 1 in 4 of Hispanic/Latinx and Indigenous People/Alaska Natives are without health insurance.During the pandemic, access to affordable health insurance has been tenuous given the millions of people who have lost their jobs, and therefore have lost access to their employer-sponsored health insurance.5,6 With the compounding impact of job loss, lack of access to healthy foods, and exposure to pollution, certain race groups that are extremely vulnerable during the pandemic are even more vulnerable because of their lack of health insurance. Even the reliance on telehealth services is not equitably accessible, with internet access not consistently available across racial groups.7
Counties with no or only one newspaper (often only a weekly) that also have high Covid rates
- “Three Months In, Many Americans See Exaggeration, Conspiracy Theories and Partisanship in COVID-19 News.” Mitchell, Jurkowitz, Oliphant, and Shearer. Pew Research Center. June 2020. https://www.journalism.org/2020/06/29/three-months-in-many-americans-see-exaggeration-conspiracy-theories-and-partisanship-in-covid-19-news/
- “The coronavirus pandemic keeps evolving. So does the news coverage, as these six stories show.” Nickens. Poynter. October, 2020. https://www.poynter.org/reporting-editing/2020/the-coronavirus-pandemic-keeps-evolving-so-does-the-news-coverage-as-these-six-stories-show/
- “‘We move the economy’: How Latino-owned businesses are meeting unique challenges.” Contreras. Indianapolis Star. September, 2020. https://www.indystar.com/story/news/local/2020/09/28/indianapolis-latino-owned-businesses-get-help-facing-unique-challenges/5387240002/
- Personal communication with infectious disease specialist Dr. William Pewen, August 2020
- “News Deserts And Ghost Newspapers: Will Local News Survive?” UNC Hussman School of Journalism and Media. 2020. https://www.usnewsdeserts.com/reports/news-deserts-and-ghost-newspapers-will-local-news-survive/
- “The coronavirus has closed more than 50 local newsrooms across America. And counting.” Hare. Poynter. August, 2020. https://www.poynter.org/locally/2020/the-coronavirus-has-closed-more-than-25-local-newsrooms-across-amer ica-and-counting/
Internet access by race
- “As schools close due to the coronavirus, some U.S. students face a digital ‘homework gap’.” Auxier, Anderson. Pew Research Center. March, 2020. https://www.pewresearch.org/fact-tank/2020/03/16/as-schools-close-due-to-the-coronavirus-some-u-s-students-face-a-digital-homework-gap/
Undergraduate and graduate enrolment by race and ethnicity
- “Freshman enrollment drops significantly at U.S. universities and community colleges.” Hubler. The New York Times. October, 2020. https://www.nytimes.com/2020/10/15/world/freshman-enrollment-drops-significantly-at-us-universities-and-community-colleges.html
- “The Great Recession spurred student interest in higher education, Stanford expert says.” Parker. Stanford. March, 2015. https://news.stanford.edu/2015/03/06/higher-ed-hoxby-030615/
Lack of health insurance coverage by race/ethnicity
- “The Coastal Index 2017.” Plyer. The Data Center. June, 2017. https://www.datacenterresearch.org/reports_analysis/the-coastal-index-2017/
- “Opportunity For Growth.” Parilla. Metropolitan Policy Program at Brookings. September, 2017. https://www.brookings.edu/wp-content/uploads/2017/09/metro_20170927_opportunity-for-growth-iedl-report-parilla-final.pdf
- “Landrieu Announces New Business Model For Economic Development Delivered by NOLABA.” New Orleans Business Alliance. November, 2017. https://www.nolaba.org/nolaba-network-economic-opportunity/
- “The Allocation of Talent and U.S. Economic Growth. Hsieh, Hurst, Jones, and Klenow. The Econometric Society. September, 2019. http://klenow.com/HHJK.pdf
- “The Impact of the COVID-19 Pandemic on Access to Health Care.” Cole. National Academy of Social Insurance. July, 2020. https://www.nasi.org/research/2020/impact-covid-19-pandemic-access-health-care
- “Covid-19 and the Need for Health Care Reform.” King. The New England Journal of Medicine. June, 2020. https://www.nejm.org/doi/full/10.1056/NEJMp2000821
- “Types of Computers and Internet Subscriptions. The U.S. Census Bureau. 2018. https://data.census.gov/cedsci/table?q=internet&g=0100000US.04000.001&tid=ACSST1Y2018.S2801&hidePreview=true