To begin to recover from any disaster, an assessment of damages is a necessary first step. In the case of Covid, the damage is not related to a single event. Instead, pandemic-related damages will continue to unfold until an effective vaccine is developed and universally distributed. As such, tracking Covid-related damage will require monitoring more than one metric over multiple months.
This section tracks a select number of highly-vetted indicators to examine the extent of Covid-related damage to lives and livelihoods. It examines how peoples’ lives are faring, and how this impact differs across different sections of society. It also looks at damage to livelihoods state by state.
Much of the current discussion about the pandemic is limited to indicators focusing on the health and economic impacts. In later sections of this report, these indicators serve as a backdrop for a unique analysis of the complex interactions between the pandemic and our nation’s civic health.
As more data becomes available, additional metrics will be added to this section to better assess how states are protecting lives and livelihoods.
Indicators in this section
- New Covid cases in past week
- Age-adjusted Covid-associated hospitalization rates by race/ethnicity
- Excess deaths during the pandemic
- Total jobs lost
- Small business closures
- Unemployment claims
The South and Midwest have the highest Covid case rates, with hotspots continuing to erupt across the nation, including rural communities.
Average daily cases per 100,000 population in past week, by county
Analysis of state and local health agencies and hospitals data as of Oct 21, 2020
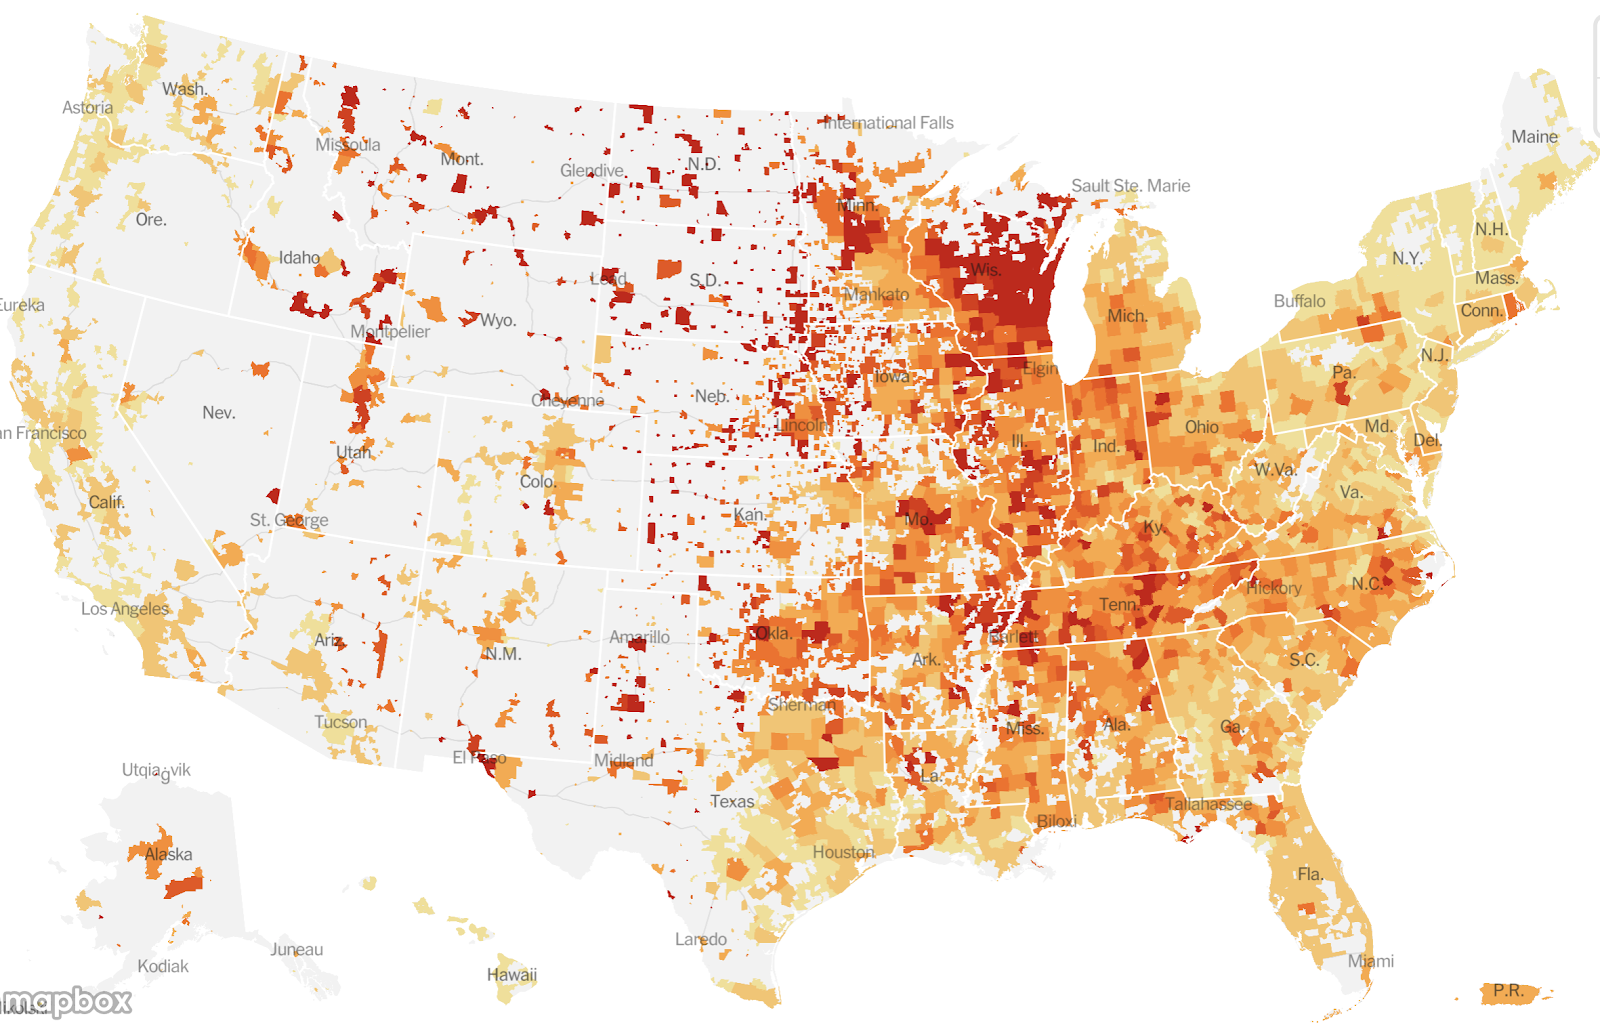

Source: From The New York Times. © 2020 The New York Times Company. All rights reserved. Used under license.
With daily Covid diagnostic testing volume at approximately 1 million per day, current testing remains insufficient for pandemic management, and it means cases may represent as few as 1 in 5 actual Covid infections.1,2,3 While some claim that increased testing produces higher numbers of Covid cases, screening of those not presenting with either exposure risk or symptoms should actually result in a lower positive test rate.4,5 The majority of states and territories now exceed the 5% positivity benchmark recommended by the World Health Organization, with some now exceed 20% positive results.6
Covid infections are now elevated or escalating in more than 40 states. While the greatest impact is seen in the Midwest, Mississippi Valley, and Mountain state regions, incidence is rising in most of the nation. Many areas of extraordinarily high rates of infection exceeding 250 new cases in the last week per 100k population suggest imminent threats to health system capacity, given anticipated hospitalization rates and corresponding rises in mortality. While some local leaders attribute these flare-ups to people “not respecting the disease, ” ignoring precautions, and letting “down their guard”, more definitive causes can be elucidated. Namely, the dual impacts of inadequate testing and failure to establish action thresholds, coupled with what Dr. Anthony Fauci has termed, “an anti-authority feeling” are likely key factors in large outbreaks.7,5 Public health officials warn that an imminent third peak of infection is likely as the nation heads indoors for the winter and holiday gatherings.8
American Indian/Alaskan Native, African American, and Hispanic/Latinx individuals are ~4.5 times more likely to have severe Covid impacts than white individuals.
Age-adjusted Covid-associated hospitalization rates, March 1-October 10, 2020
By race and ethnicity
Source: CDC
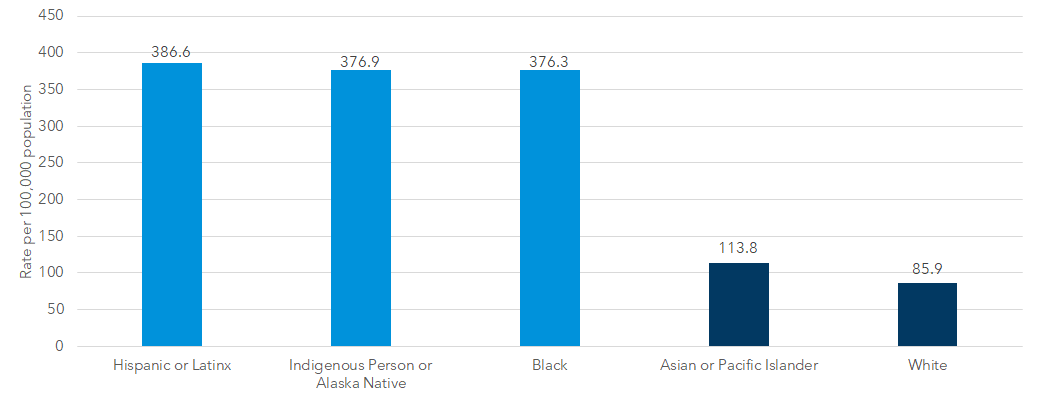
Available data on hospitalizations continues to illuminate stark disparities between racial groups. Hispanic/Latinx, Black, and Indigenous individuals are around 4.5 times more likely to be hospitalized or die due to Covid than white people.
Racial disparities in health outcomes have existed long before Covid, and only partially explain the divide in this pandemic. Emerging research points to occupational exposure as a key driver of higher infection rates.1 Populations of color most impacted by Covid are over-represented in front-line work such as agriculture, food processing, transportation, janitorial work, and caregiving, and thus are not granted the privilege of working from home.2,3,4 Plus the cumulative health impacts of living in unsafe neighborhoods, breathing polluted air, having less access to healthy foods or quality medical care, and a lifetime of experiencing racial discrimination mean that these populations also have higher rates of comorbidities such as diabetes, heart disease, and obesity that are associated with greater morbidity and mortality in Covid cases.5,6,7,8
However, a recent report by Politico highlighted the state of Michigan’s intentional work to close the racial disparity in Covid health impact. In March and April, African Americans comprised 40% of Covid deaths in Michigan, despite making up only 14% of the state population. By the end of September, the proportion of Covid deaths for African Americans was down to 10%.9
For every 2 known Covid deaths, 1 additional person has died above the level of expected deaths, based on historic norms.
Excess deaths, Covid and Non-Covid related
Above expected levels from average through July 31, 2020
Source: Excess Deaths From COVID-19 and Other Causes, March-July 2020 in JAMA by Woolf, Chapman, Sabo, Weinberger, Hill, & Taylor.

Note: Deaths in North Carolina and Connecticut are excluded due to delays in digitizing data.
Soon after the pandemic began, emergency room staff noticed that their normal flow of patients with chest pain, appendicitis, bowel obstruction, and strokes had slowed to a trickle. Other healthcare providers noticed patients canceling follow-ups for cancer treatment, orthopedic issues, and chronic disease.1,2,3 Nearly 1 in 3 families have missed a well-child visit since the pandemic began.4 On the flip side, some patients seeking care have found their doctors’ offices shuttered temporarily or permanently, or shifting to telehealth.5,6
It is not surprising in this context that for every 2 known Covid deaths, 1 additional person has died beyond the number expected.7 Such “excess deaths” reflect a variety of challenges. Some of these excess non-Covid deaths could have been misclassified and were actually Covid cases, some may have been patients reluctant to seek care in a pandemic, and others may have fallen victim to cracks in the healthcare system. A recent letter to the Journal of the American Medical Association noted that the U.S. ranks among the highest nations experiencing excess deaths, and attribute this in part to “weak public health infrastructure and a decentralized, inconsistent U.S. response to the pandemic.”8
Hispanic individuals have the largest average percentage of excess deaths at 54% compared to previous years. American Indian/Alaskan Native, Black, and Asian people have increases of ~29-37%, and the white population has the lowest increase at 12%.9 These disparities may be related to pre-pandemic health disparities, the disproportionate loss of income and health insurance, and/or limited access to internet and therefore telehealth in communities of color.
The U.S. has 9.6 million fewer jobs than one year earlier. 2 states have more than 1 million fewer jobs and 6 states have at least 400k fewer jobs.
Total jobs by month, U.S.

Source: Bureau of Labor Statistics
Loss of jobs by state, September 2020 compared to September 2019
Employment by state, seasonally adjusted
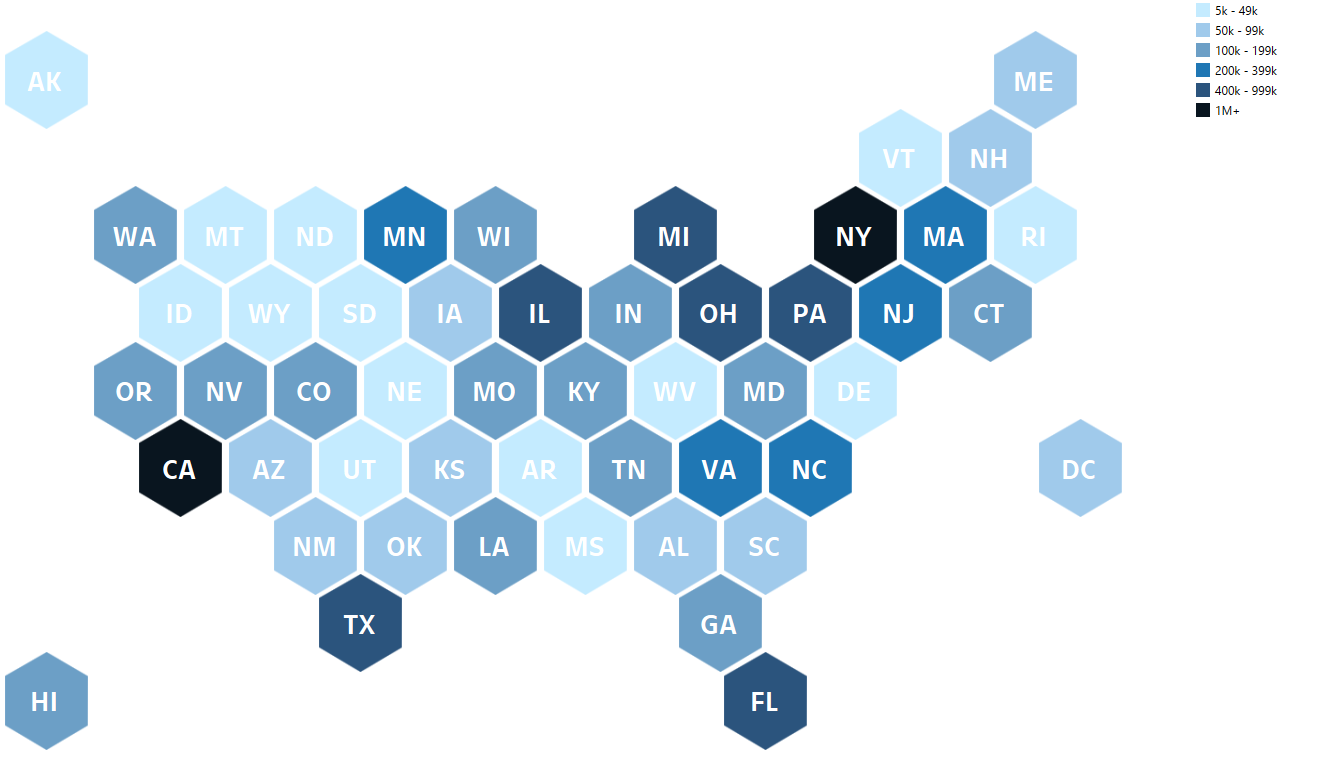
Source: Bureau of Labor Statistics Note: Data for July 2020 and August 2020 are preliminary
The total number of U.S. jobs fell from a high of 152 million in February 2020 to a low of 130 million by April 2020. While jobs have rebounded an impressive 11.4 million since April, the total number of jobs in September at 141 million is still 10.7 million fewer than the February peak. This is the lowest number of jobs in the U.S. since June 2015. Both California and New York have at least 1.1 million fewer jobs compared to last September. Texas, Pennsylvania, Florida, Michigan, Illinois, and Ohio each lost more than 400,000 jobs in September compared to a year ago.
1 in 4 of all small businesses in the U.S. that were open in January 2020 are now closed. Despite restrictions being lifted, fears of the virus have depressed demand particularly at businesses serving higher-income neighborhoods.
Percent change in number of small businesses open, September 29, 2020
7-day moving average, indexed to Jan 4-21, 2020, and seasonally adjusted. “Open” is defined as having financial transaction activity. Small businesses are defined by SBA thresholds for annual revenues, which vary by 6-digit NAICS codes.
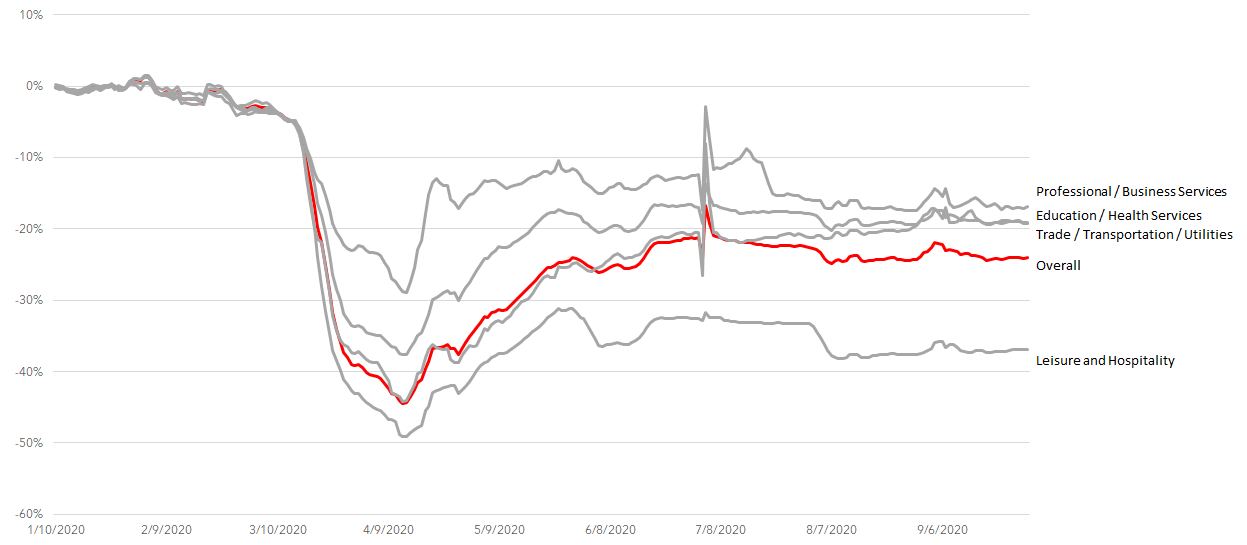
Source: Opportunity Insights
The Covid-triggered recession has taken a tremendous toll on small businesses. In compliance with shutdown orders intended to stem the spread of the virus, fully 44% of all small businesses that had been open in January 2020 were closed in April. By summer, as more states began to ease restrictions, many businesses reopened and only 22% of small businesses remained closed. However, a sizable number of small businesses have since closed again as fears of the virus itself depress demand in many sectors and regardless of additional lifting of restrictions. As of October, 24% of businesses that were open in January are now closed.
Small businesses in leisure and hospitality industries have been hit particularly hard, with 37% of these businesses closed in October. But even 17% of small businesses in professional and business services are closed, as are 19% of small businesses in trade and 19% of small businesses in education and health sectors. An analysis by Opportunity Insights found that demand has decreased most dramatically in higher-income neighborhoods, and small businesses serving these neighborhoods have suffered the largest decreases in revenue.1
In September, continuing unemployment claims declined, but remained nearly twice as high as the peak of the Great Recession. All told, 23 million people are receiving either standard unemployment or special PUA benefits.
Continuing unemployment claims, regular state and Pandemic Unemployment Assistance (PUA)
Through September 19, 2020
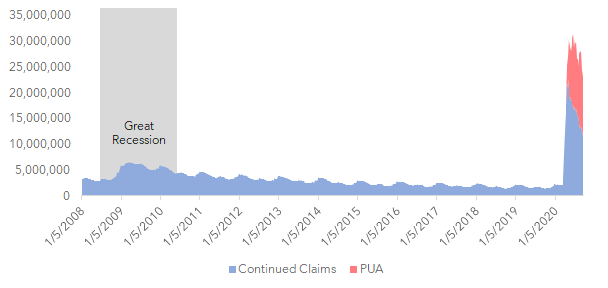
Source: Department of Labor, Economic Policy Institute Note: Reflects non-seasonally adjusted numbers, due to change in counting methods. PUA and Continued Claims should be non-overlapping, but in some instances may be due to counting errors.
There were 3.5 times more continued unemployment claims during the peak of the Covid pandemic (compared to the peak of the Great Recession). In September, continuing unemployment claims are declining, but as of September 19, there are still nearly double the claims as compared to the Great Recession’s peak. Pandemic Unemployment Assistance (PUA) has also been made available through the end of the year to some of those not eligible for the regular assistance, such as freelancers, gig workers, and contractors.
Due to the enormous job loss, Congress approved an additional $600 in weekly unemployment benefits in March. But this support ended in late July, and unemployed workers are now receiving only 40% on average of their pre-pandemic wages per week.2 In addition, research from Opportunity Insights concludes that while the effects of stimulus payments and the PPP program on consumer spending has been minimal, social safety net programs like unemployment benefits have the potential to spur demand and support jobs.3 In fact, one economic analysis estimated that the loss of the additional $600/month would reduce consumer spending and lead to the loss of roughly 2 million jobs over the next year.4
References:
Average daily cases per 100,000 people in past week, by county
- “Coronavirus (COVID-19) Testing.” Ritchie, Ortiz-Ospina, Beltekian, Mathieu, Hasell, Macdonald, Giattino, and Roser. Our World in Data. October, 2020. https://ourworldindata.org/coronavirus-testing
- “Defining the Epidemiology of Covid-19 — Studies Needed.” Lipstitch, Swerdlow, and Finelli. The New England Journal of Medicine. March, 2020. https://www.nejm.org/doi/pdf/10.1056/NEJMp2002125?articleTools=true
- “Covid-19: four fifths of cases are asymptomatic, China figures indicate.” Day. BMJ. April, 2020. https://www.bmj.com/content/369/bmj.m1375
- “South Dakota surpasses 30,000 total COVID-19 cases.” KOTA. October, 2020. https://www.kotatv.com/2020/10/14/south-dakota-surpasses-30000-total-covid-19-cases/
- Personal communication with infectious disease specialist Dr. William Pewen, October, 2020.
- “Which U.S. States Meet WHO Recommended Testing Criteria?” Johns Hopkins University of Medicine. October, 2020. https://coronavirus.jhu.edu/testing/testing-positivity
- “Dr. Anthony Fauci: There is a general anti-science, anti-authority, anti-vaccine…” Dr. Anthony Fauci. Youtube. June, 2020. https://www.youtube.com/watch?v=mlg3bpedAEk
- “Coronavirus Cases, Hospitalizations Are Increasing in Majority of States.” Smith-Schoenwalder. US News. October, 2020. https://www.usnews.com/news/national-news/articles/2020-10-20/coronavirus-cases-hospitalizations-are-increasing-in-majority-of-states
Age-adjusted Covid-19-associated hospitalization rates
- “To protect frontline workers during and after COVID-19, we must define who they are.” Tomer, Kane. Brookings Institution. June, 2020 https://www.brookings.edu/research/to-protect-frontline-workers-during-and-after-covid-19-we-must-define-who-they-are/
- “A Basic Demographic Profile of Workers in Frontline Industries.” Rho, Brown, and Fremstad. CEPR. April, 2020. https://cepr.net/wp-content/uploads/2020/04/2020-04-Frontline-Workers.pdf
- “Differential occupational risk for COVID‐19 and other infection exposure according to race and ethnicity.” Hawkins. American Journal of Industrial Medicine. June, 2020. https://onlinelibrary.wiley.com/doi/full/10.1002/ajim.23145
- “Report of the Secretary’s task force on black and minority health.” Heckler. U.S. Department of Health and Human Services. 1985.
- “Unequal treatment: Confronting racial and ethnic disparities in health care.” The National Academies Press. Institute of Medicine. 2003.
- “A decade of studying implicit racial/ethnic bias in health care providers using the implicit association test.” Maina, Belton, Ginzberg, Singh, and Johnson. Social Science & Medicine. 2018.
- “’Weathering’ and Age Patterns of Allostatic Load Scores Among Blacks and Whites in the United States.” Geronimus, Hicken, Keen, and Bound. American Journal of Public Health. December, 2005 https://pubmed.ncbi.nlm.nih.gov/16380565/
- “Structural racism and health inequities in the USA: evidence and interventions.” America: Equity and Equality in Health. Bailey, Krieger, Agenor, Graves, Linos, and Bassett. April, 2017. https://www.thelancet.com/journals/lancet/article/PIIS0140-6736(17)30569-X/fulltext
- “National Diabetes Statistics Report 2020.” Center for Disease Control. 2020. https://www.cdc.gov/diabetes/pdfs/data/statistics/national-diabetes-statistics-report.pdf
Excess deaths, Covid and Non-Covid related
- “Patients with heart attacks, strokes and even appendicitis vanish from hospitals.” Bernstein, Sellers. The Washington Post. April, 2020. https://www.washingtonpost.com/health/patients-with-heart-attacks-strokes-and-even-appendicitis-vanish-from-hospitals/2020/04/19/9ca3ef24-7eb4-11ea-9040-68981f488eed_story.html
- “With cancer screenings dropping during pandemic, Carroll County medical professionals urging patients to reschedule.” Conaway. Carroll County Times. October, 2020. https://www.baltimoresun.com/maryland/carroll/news/cc-cancer-screening-during-pandemic-20201021-7i5fzg4hbfbh3jnqjsftbbusfy-story.html
- “Health crisis looming inside a health crisis: People are avoiding going to the doctor.” Glionna. Los Angeles Times. July, 2020. https://www.latimes.com/california/story/2020-07-29/coronavirus-people-avoid-visits-to-doctor
- “COVID-19 Tanks Pediatric Healthcare Access, Well-Child Visits.” Heath. Patient Care Access News. October, 2020. https://patientengagementhit.com/news/covid-19-tanks-pediatric-healthcare-access-well-child-visits
- “Assessing COVID-19’s toll on Black physicians’ practices.” Read. The Philadelphia Tribune. October, 2020. https://www.phillytrib.com/news/health/coronavirus/assessing-covid-19-s-toll-on-black-physicians-practices/article_adb855fe-a123-5fcb-aa54-9939dd59776a.html#/questions
- “The doctor will Zoom you now: Telehealth visits surging in Carson-Reno.” Roedel. Northern Nevada Business Weekly. October, 2020. https://www.nnbw.com/news/the-doctor-will-zoom-you-now-telehealth-visits-surging-in-carson-reno/
- “Excess Deaths From COVID-19 and Other Causes, March-July 2020.” Woolf, Chapman, and Sabo. JAMA. October, 2020. https://doi.org/10.1001/jama.2020.19545
- “COVID-19 and Excess All-Cause Mortality in the US and 18 Comparison Countries.” Bilinski, Emanuel. JAMA Network. October, 2020. https://jamanetwork.com/journals/jama/fullarticle/2771841
- “Excess Deaths Associated with COVID-19, by Age and Race and Ethnicity — United States, January 26–October 3, 2020.” Rossen, Branum, Ahmad, Sutton, and Anderson. CDC. October, 2020. https://www.cdc.gov/mmwr/volumes/69/wr/mm6942e2.htm
Total Jobs Lost
- “Employment, Hours, and Earnings from the Current Employment Statistics survey (National).” Bureau of Labor Statistics. October, 2020. https://data.bls.gov/timeseries/CES0000000001&output_view=net_1mth
- “Employment by state, seasonally adjusted.” Bureau of Labor. https://www.bls.gov/charts/state-employment-and-unemployment/employment-by-state-bar.htm
Small Business Closures
- “The Economic Impacts of COVID-19: Evidence from a New Public Database Built Using Private Sector Data.” Chetty, Friedman, Hendren, Stepner, et al. Opportunity Insights. October, 2020. https://opportunityinsights.org/wp-content/uploads/2020/05/tracker_paper.pdf
Unemployment Claims
- “Unemployment Insurance Weekly Claims Data.” U.S. Department of Labor. September, 2020. https://oui.doleta.gov/unemploy/claims.asp
- “Total initial UI claims have risen in each of the last four weeks.” Shierholz. Economic Policy Institute. September, 2020. https://www.epi.org/blog/total-initial-ui-claims-have-risen-in-each-of-the-last-four-weeks-congress-must-act/
- How Did COVID-19 and Stabilization Policies Affect Spending and Employment? A New Real-Time Economic Tracker Based on Private Sector Data.” Chetty, Friedman, Hendren, Stepner, et al. Opportunity Insights. June, 2020. https://opportunityinsights.org/wp-content/uploads/2020/05/tracker_paper.pdf
- “Prepared Testimony on ‘The Unemployment Pandemic: Addressing America’s Jobs Crisis.’” Furman. June, 2020. https://docs.house.gov/meetings/VC/VC00/20200618/110811/HHRG-116-VC00-Wstate-FurmanJ-20200618.pdf