

October 2026
Americans, AI, and the 2026 Midterms
How many people are turning to AI chat programs for election information, and how much they trust it
About the survey. Two independent national samples of U.S. adults, interviewed by SSRS on its probability-based Opinion Panel Omnibus: Oct. 1–4, 2026 (n=1,033) and Oct. 15–18, 2026 (n=1,030). Web and telephone, in English and Spanish. Margin of error ±3.4 percentage points for each full sample at the 95% confidence level; about ±4.8 points for a difference between the two waves. The same questions were asked in both waves. Full methodology, question wording and toplines are at the end of this report.
Summary
One in four Americans say they have used an AI chat program to learn about the candidates for U.S. Senate, House or Governor as they decide how to vote, up from one in seven two weeks earlier. In two surveys commissioned by NCoC in collaboration with researchers at The Carter Center, conducted by SSRS in early and mid-October 2026, the share who had turned to AI for that purpose rose from 14% to 25%. Counting any of four election tasks, including finding out how to vote and checking election stories, the share rose from 28% to 40%. Republicans and Democrats report using AI for election information at similar rates, and Black, Hispanic and other non-white adults report using it at markedly higher rates than White adults. Trust did not rise with use. About one in five adults trust AI systems “a great deal” or “quite a bit” to give unbiased information about candidates, and most of the people who use AI for election tasks say they trust it only a little or not at all for that purpose. Trust is higher, about four in ten, for information on when, where and how to vote.
Key findings
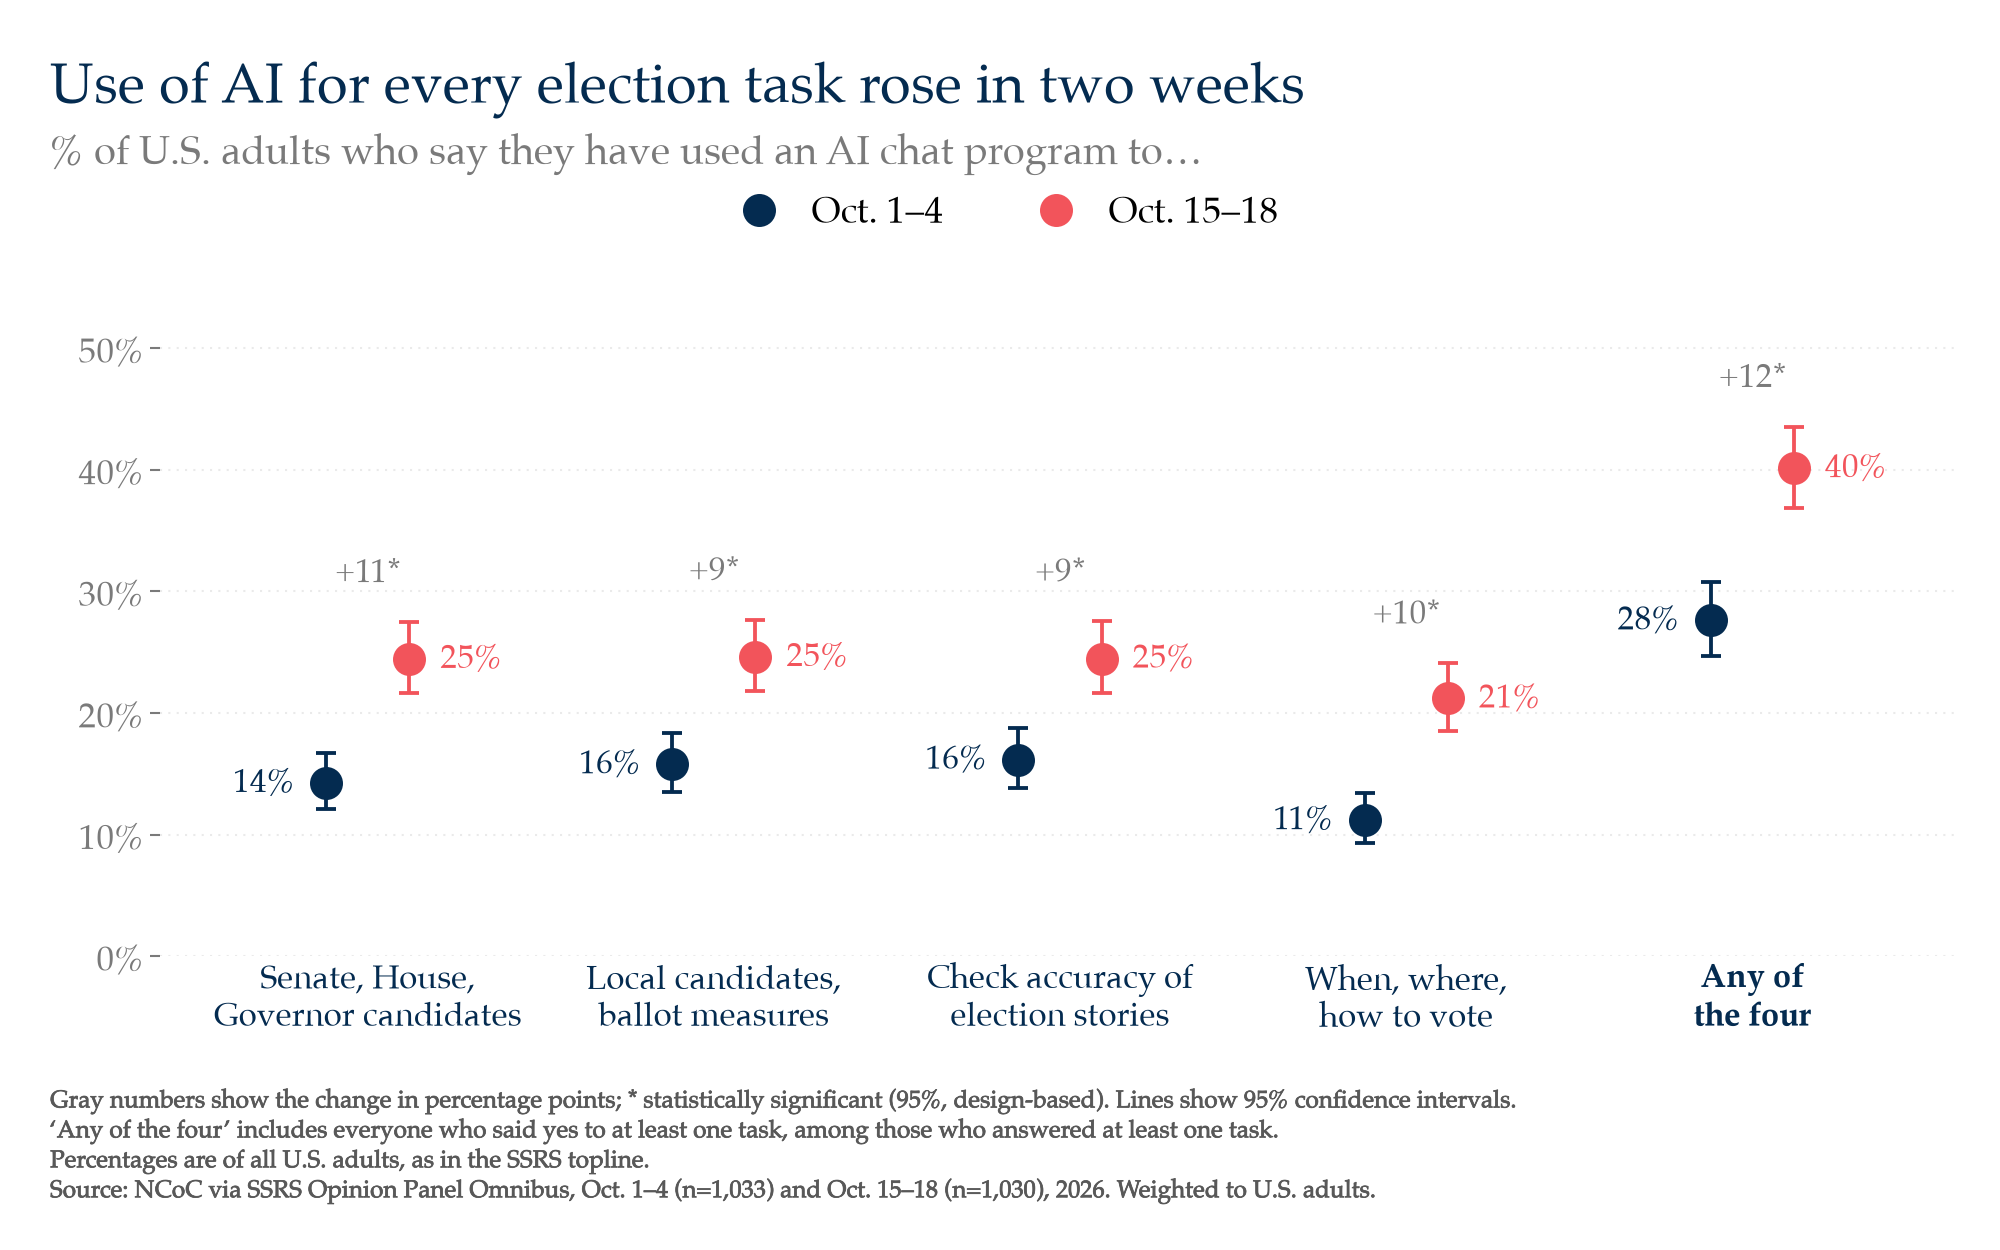
1. One in four adults (25%) now say they have used an AI chat program to learn about candidates for U.S. Senate, House or Governor as they decide how to vote, up from 14% two weeks earlier. Every one of the four election tasks asked about rose by a similar amount, and the share who had done at least one rose from 28% to 40%. All of these increases are far larger than sampling error alone would explain. The question asks whether people have used AI for these tasks this election, without a time limit, so some increase is expected as Election Day nears and more people start paying attention. Using AI for election information remains something a minority of adults do.
| Have used an AI chat program to… | Oct. 1–4 | Oct. 15–18 | Change |
|---|---|---|---|
| Learn about candidates for U.S. Senate, House, or Governor | 14% | 25% | +11 |
| Learn about candidates for local offices or ballot measures | 16% | 25% | +9 |
| Find out when, where, or how to vote | 11% | 21% | +10 |
| Check the accuracy of election stories seen elsewhere | 16% | 25% | +9 |
| Any of the four | 28% | 40% | +12 |
All four changes and the total are statistically significant. Figures are those published in the SSRS topline; changes are the difference between the rounded figures shown.
2. The increase was broad. Republicans and Republican-leaning independents (28% to 39%) and Democrats and Democratic leaners (26% to 41%) rose by similar amounts, and there is no statistically detectable difference between the parties in either wave. Most demographic groups rose. The increase was larger among men (29% to 46%) than among women (26% to 33%), and larger among adults under 50 than among those 65 and older (19% to 24%, a change that is not statistically significant). In both waves, Black and Hispanic adults were more likely than White adults to report using AI for an election task (51% and 51% vs. 32% in mid-October). In statistical models that hold age, education, income, gender, employment, party and metro status constant, race and ethnicity is the one factor that predicts use on every task in both waves. A Republican lead that appears in the early-October models, once other factors are controlled, is absent in mid-October.
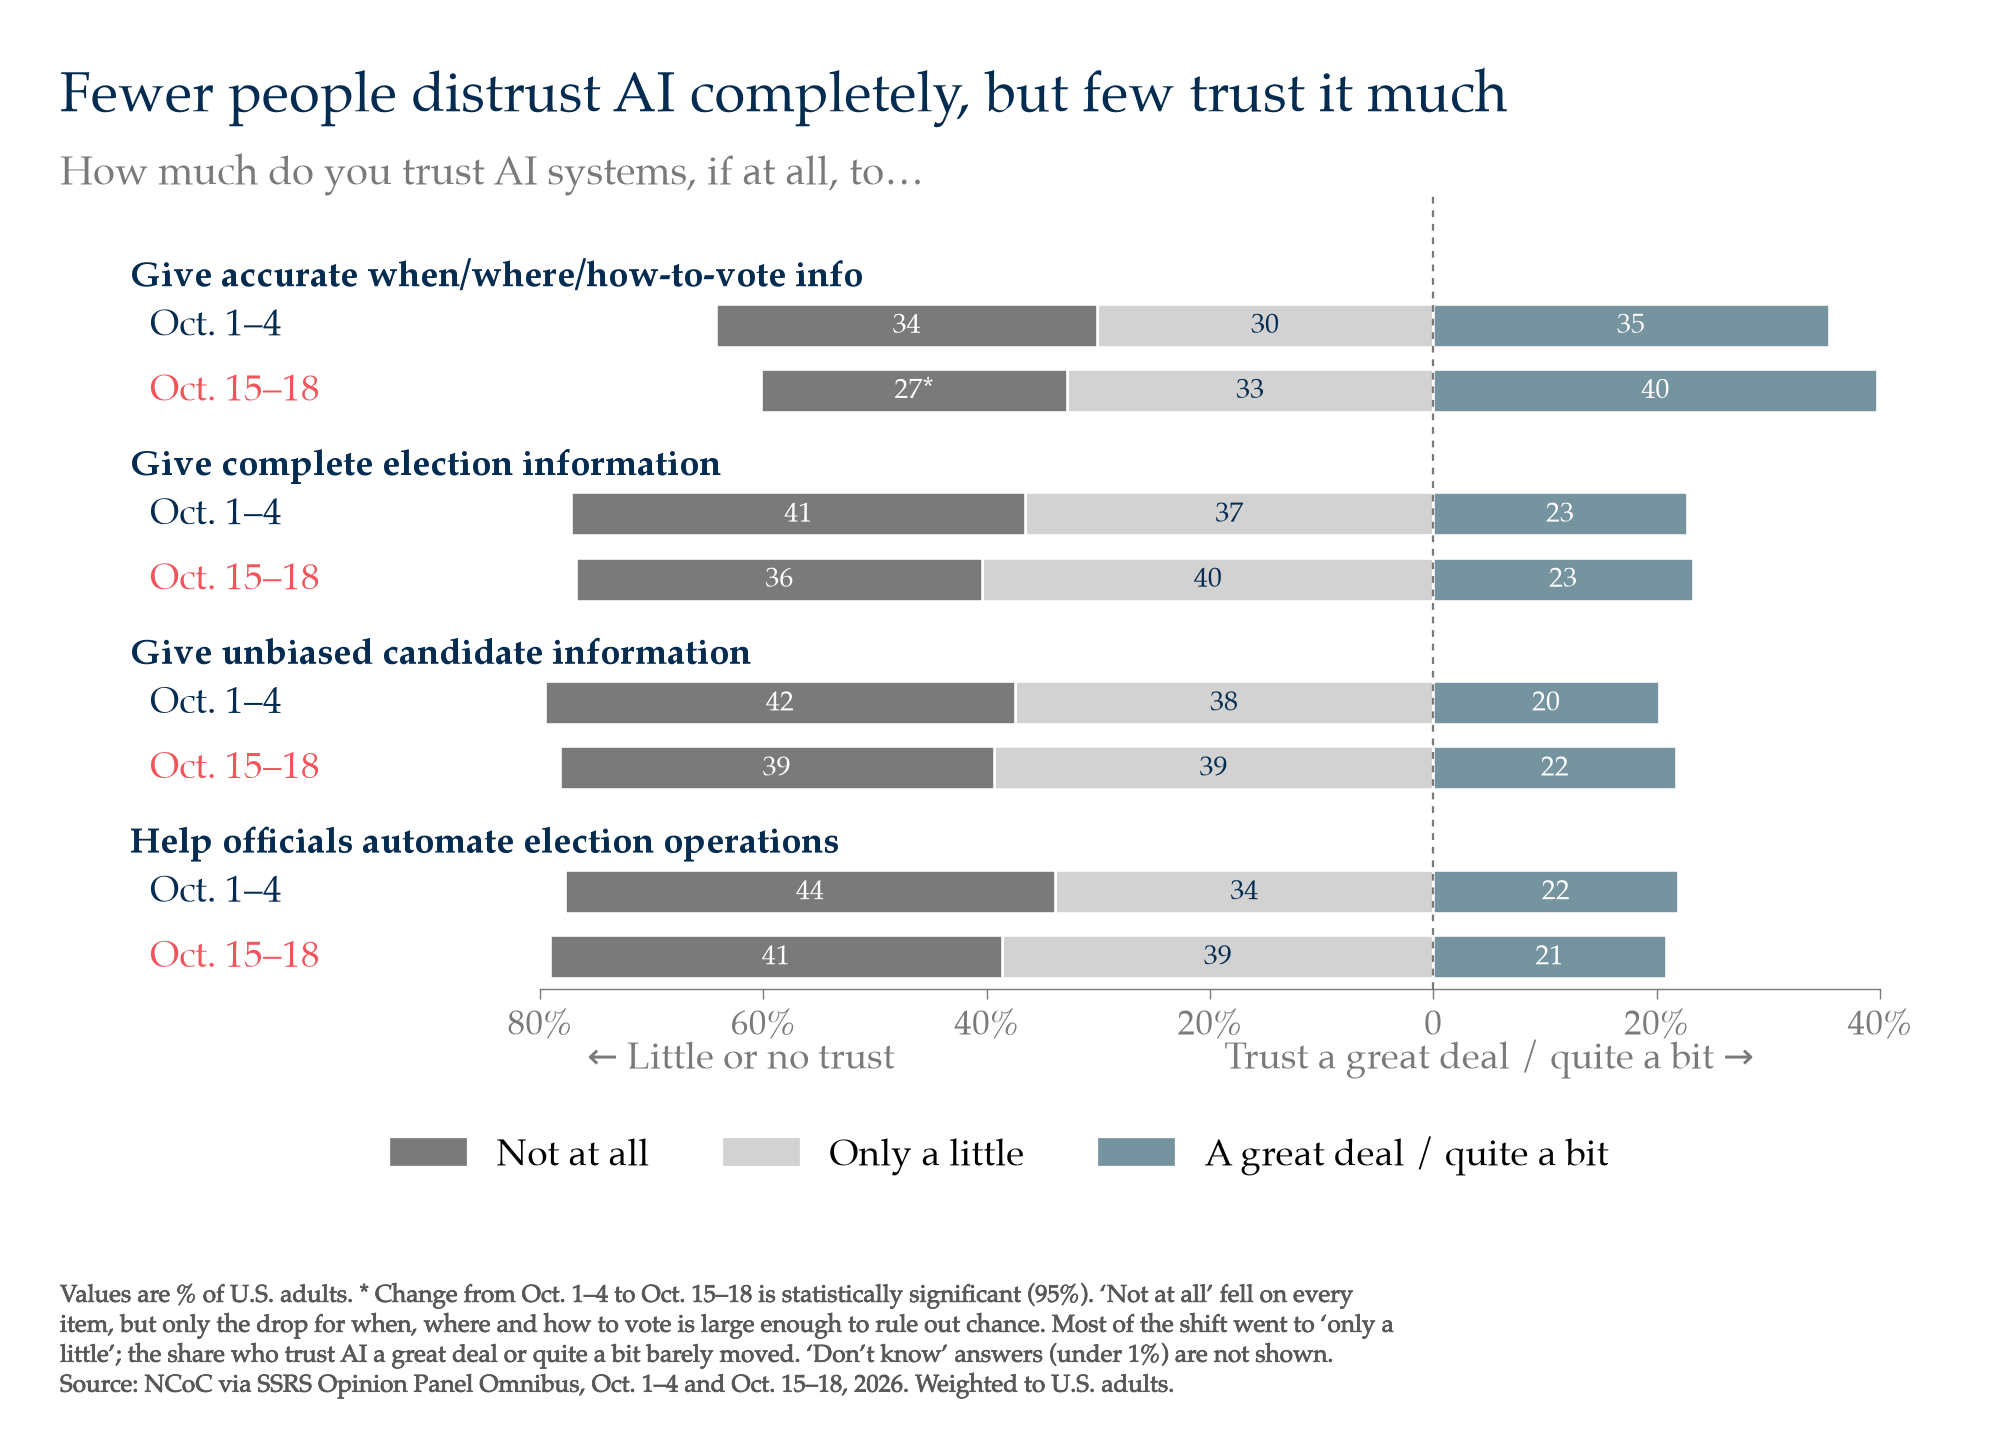
3. Trust in AI systems for election information held steady, and it is low. On three of the four trust items, the change between waves is one or two points and not significant. Between one in five and one in four adults trust AI “a great deal” or “quite a bit” to give unbiased information about candidates (20%, then 22%), to give complete information about the election (23% in both waves), or to help local election officials automate routine operations (22%, then 21%). The exception is voting logistics: trust in AI to give accurate information on when, where and how to vote edged up from 35% to 40%, and the share who trust it “not at all” for that fell from 34% to 27%.
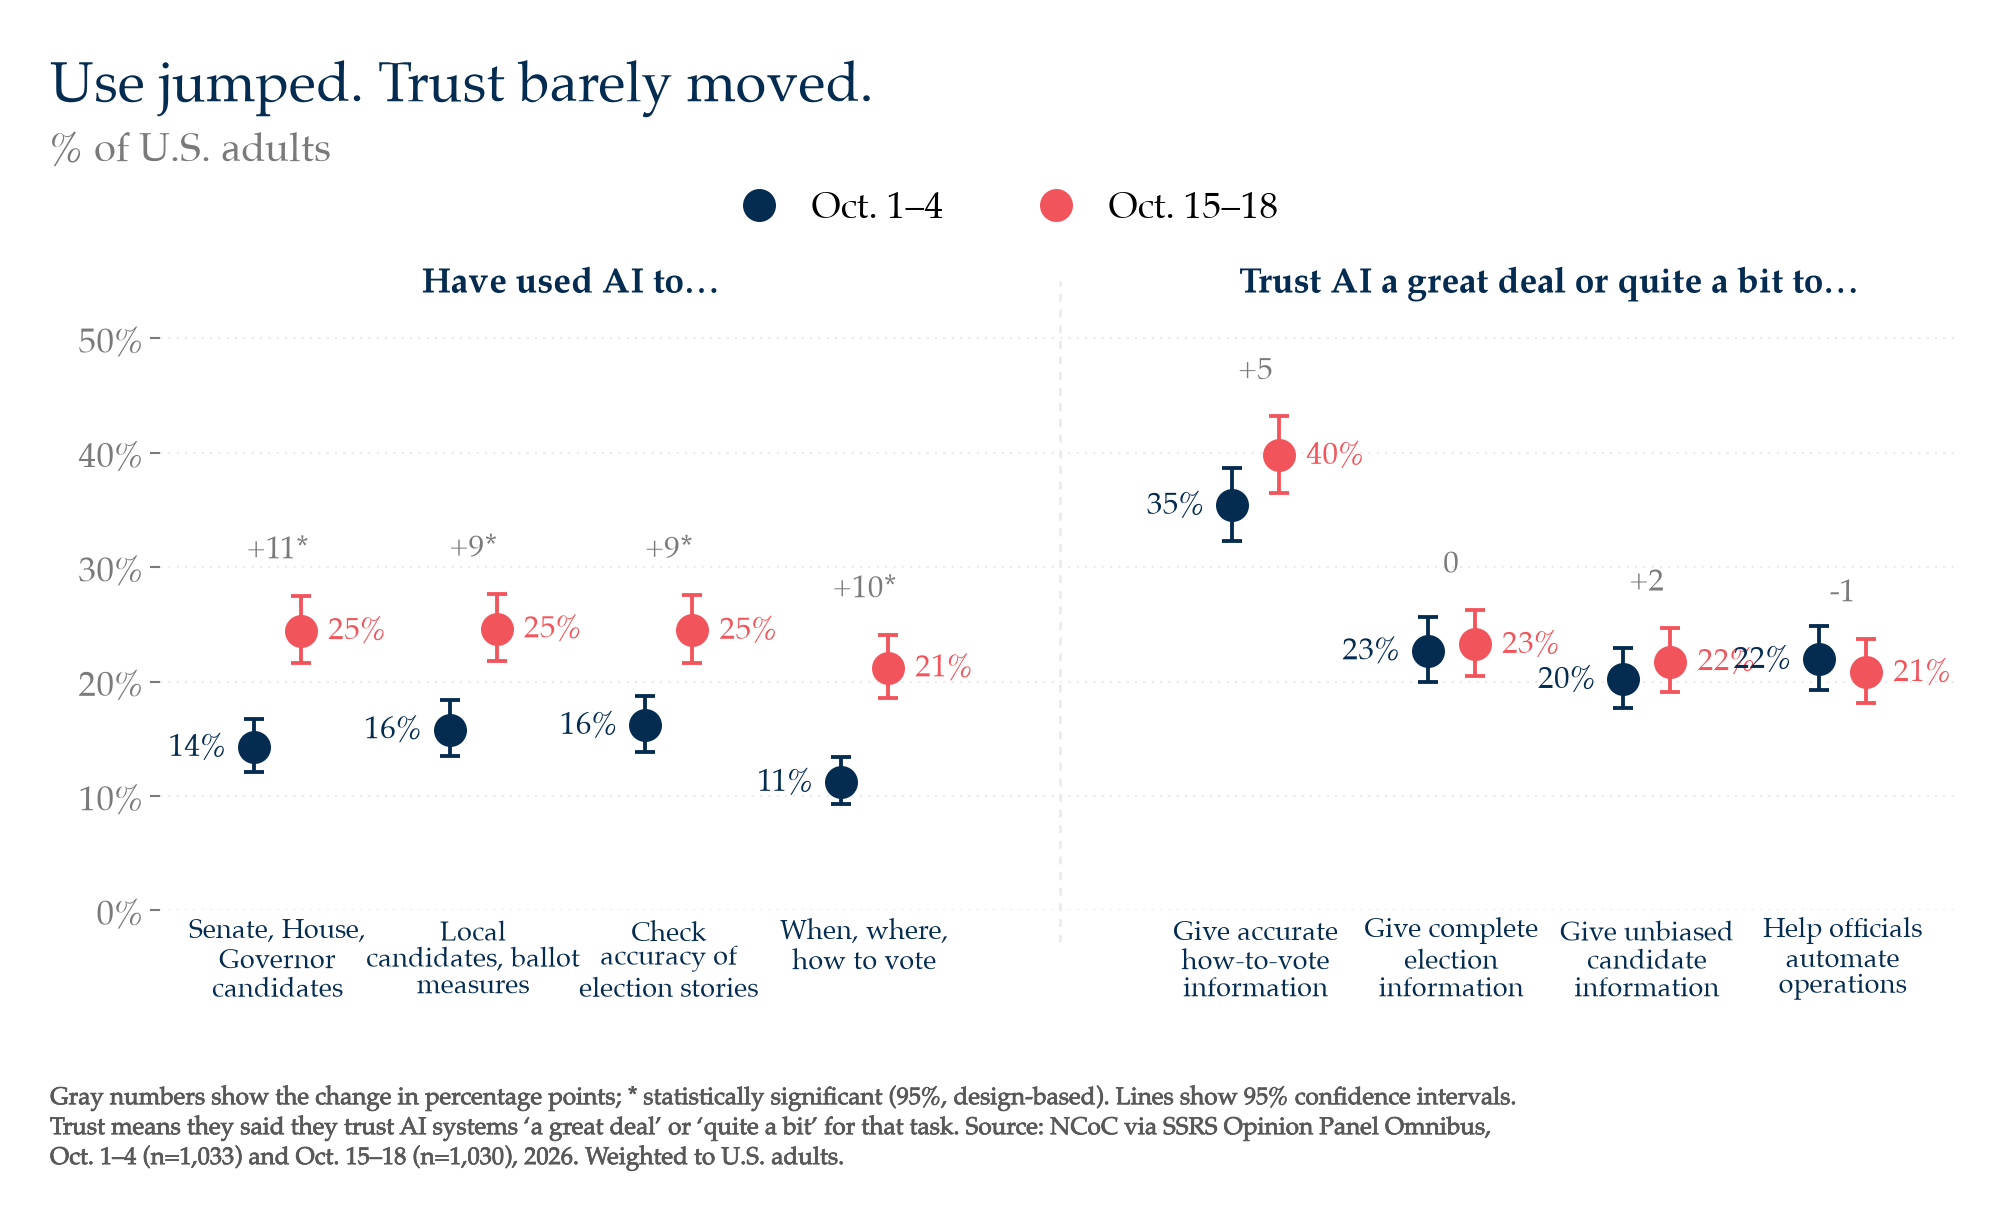
4. Trust is highest for information people can check for themselves. About four in ten adults trust AI for when, where and how to vote. The other three items, which ask about unbiased candidate information, completeness, and automating election operations, all sit at 21% to 23% in mid-October and are statistically indistinguishable from one another.
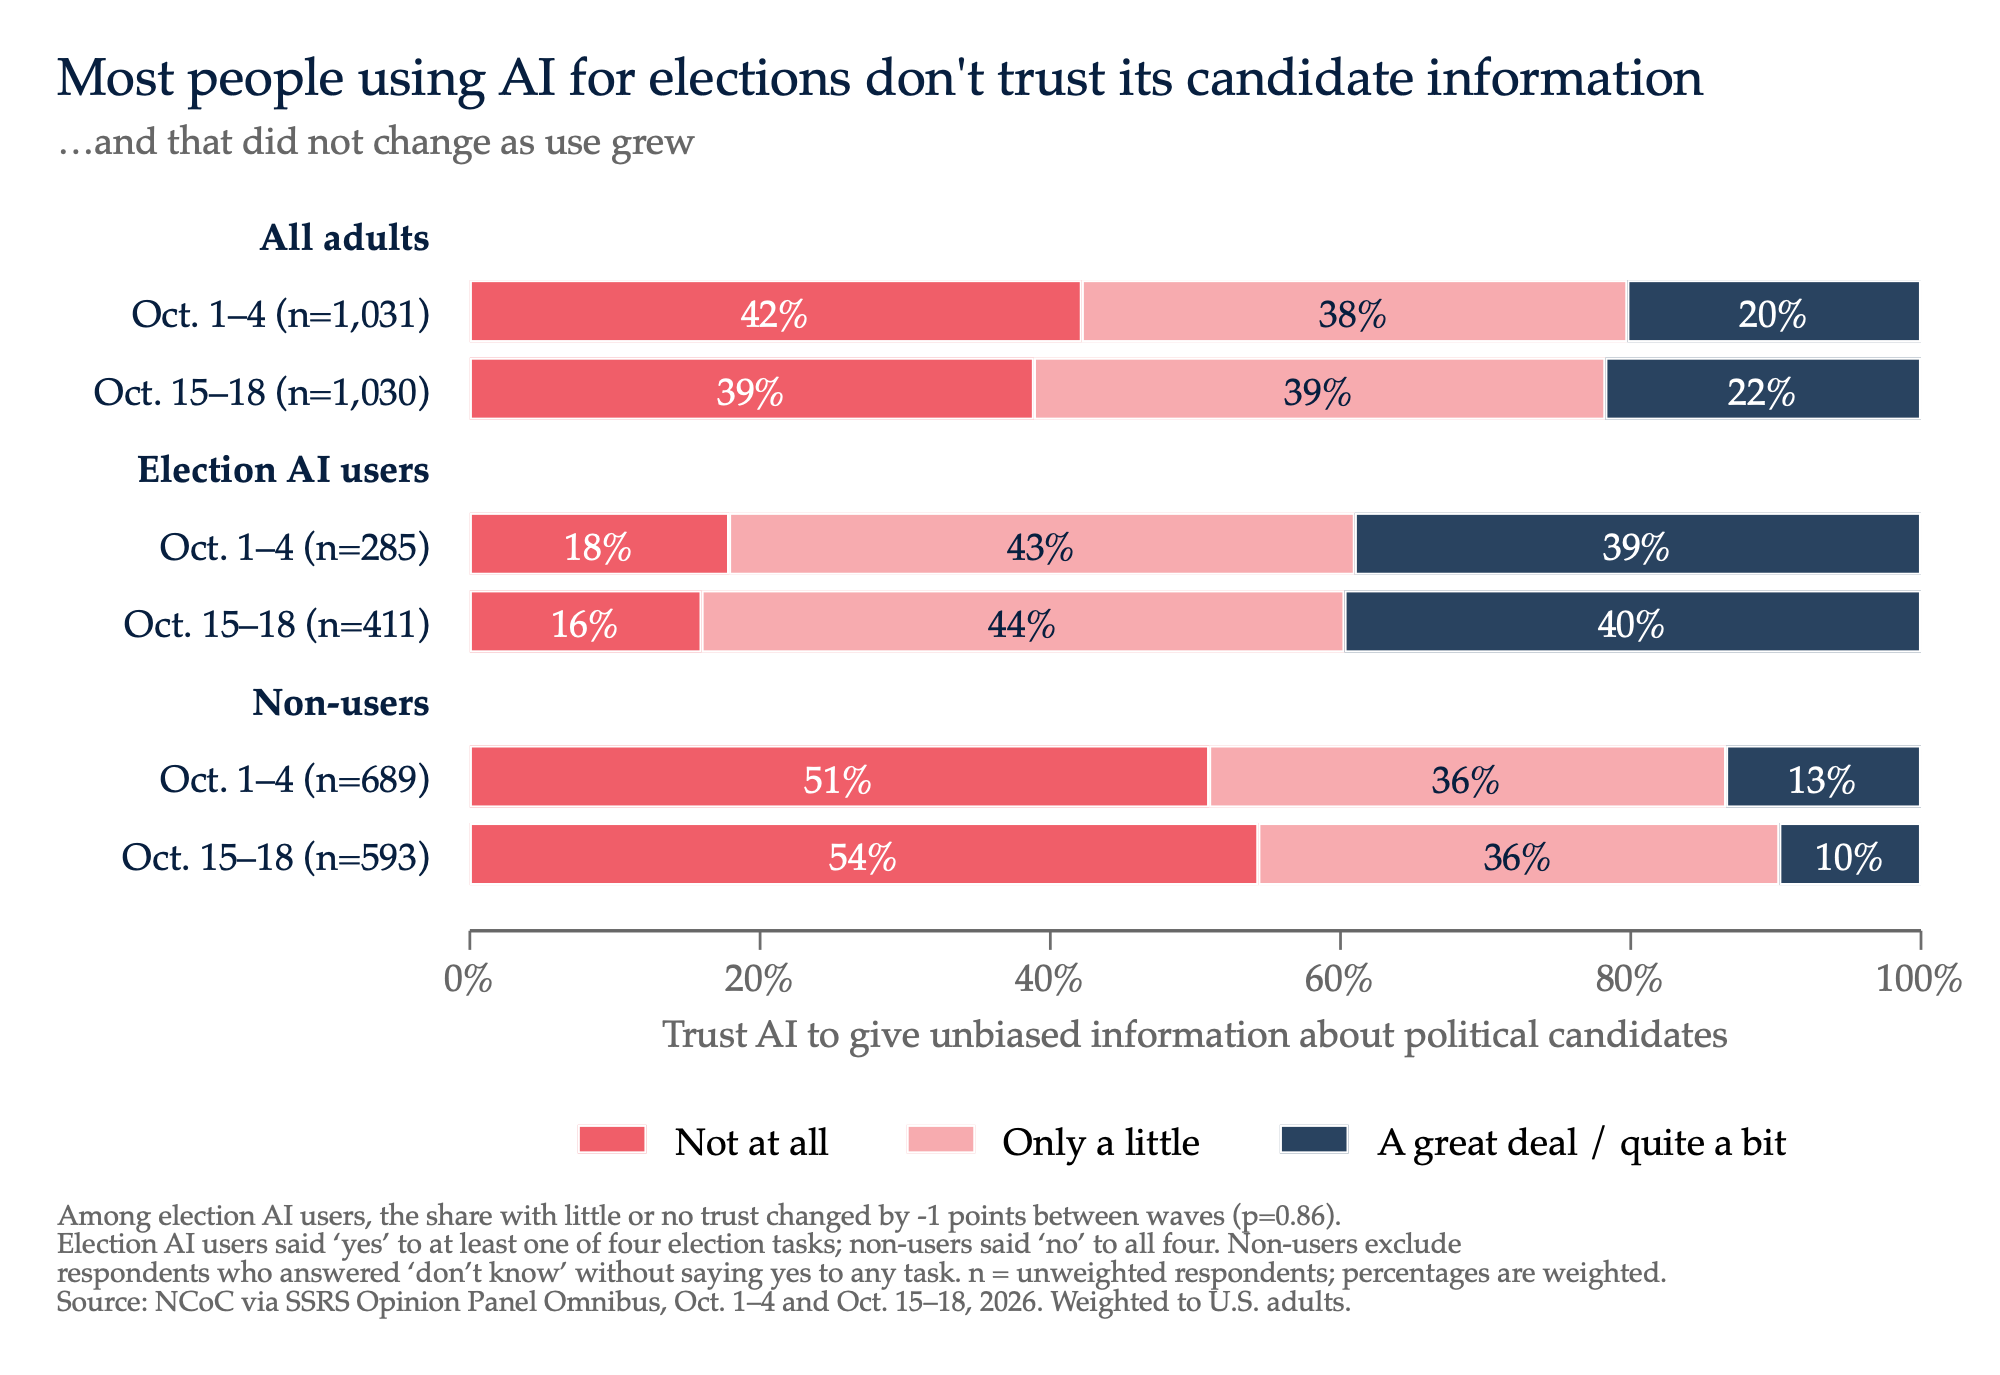
5. Most people who use AI for election tasks still have little or no trust in it for candidate information. Among mid-October users of AI for any election task, 60% trust AI systems “only a little” (44%) or “not at all” (16%) to give unbiased information about candidates. Users are far more trusting than non-users (40% vs. 10% trust AI “a great deal” or “quite a bit” on that item), but little-or-no trust is the majority position even among users. The trust profile of users was the same in both waves.
6. In their own words, people most often described asking about candidates or about how to vote. Asked to describe the most recent time they used AI for something election-related, about a third of users described a question about candidates (who is running, where they stand, their record), about a quarter described a logistics question (when and where to vote, registration, absentee ballots), and fewer than one in ten described checking whether a claim or story was true. About 7% mentioned checking the AI’s answer against another source.
7. Treat the levels as approximate. In the open-ended follow-up, about one in nine respondents who had said “yes” to a use item wrote that they had not used AI for anything election-related, could not remember, or gave no usable answer. Some described AI-generated summaries in search results rather than a chat program. Self-reports can also miss use that people do not recognize as AI. Because the pattern was similar in both waves, it is unlikely to explain the rise, but the absolute levels should be read as approximate.
About this report
NCoC commissioned these questions, in collaboration with researchers at The Carter Center, to learn how many Americans are asking AI systems for help with the 2026 election and how much they trust the answers. NCoC’s Civic AI Audit separately tests how consumer AI products, including several named in this survey, answer voters’ election questions. This survey does not measure the accuracy of AI answers; it measures reported use and trust.
Two waves of questions were placed on the SSRS Opinion Panel Omnibus. The same eight closed questions and one open-ended question were asked in both waves.
Topline figures in this report are those published by SSRS in its topline document, which is the document of record for this survey. Subgroup figures, summary measures and models were computed by NCoC from the respondent-level data supplied by SSRS, using the SSRS weights. Funding for this survey was provided by the National Conference on Citizenship. SSRS conducted the survey under contract to NCoC. Researchers at The Carter Center contributed to the questionnaire and analysis. No AI company funded, commissioned or reviewed this research. NCoC staff used Claude, an AI assistant made by Anthropic, to help write the analysis code and draft the text of this report; see the disclosure in the methodology.
Detailed findings
Throughout this report, “trust” means answering “a great deal” or “quite a bit”; “little or no trust” means “only a little” or “not at all”. “Election AI users” are adults who said yes to at least one of the four use items. “Republicans” and “Democrats” include independents who lean toward each party. Early October is the Oct. 1–4 wave; mid-October is the Oct. 15–18 wave.
1. Use of an AI chat program for election tasks
The four use items were asked of all respondents in both waves. “Yes” rose on every item, and “don’t know” fell from 4–5% to 2–3%. Part of the rise in the “any of the four” total came from respondents who would earlier have answered “don’t know”: the share with no “yes” and at least one “don’t know” fell from 6% to 2%. The first item, learning about candidates for U.S. Senate, House or Governor, is the signature measure: it asks directly whether people used AI while deciding how to vote in the major races, and it rose from 14% to 25%.
By group. The table shows the share of each group who said they had used an AI chat program for at least one of the four tasks. Groups are shown only where both waves have at least 100 respondents. Changes marked † are statistically significant at the 95% level, tested one at a time; because around two dozen comparisons are shown, one or two could be significant by chance, and individual subgroup results should be read as indicative.
| Group | Oct. 1–4 | Oct. 15–18 | Change |
|---|---|---|---|
| All adults | 28% | 40% | +12 † |
| Men | 29% | 46% | +17 † |
| Women | 26% | 33% | +7 † |
| Ages 18–29 | 31% | 49% | +18 † |
| Ages 30–49 | 29% | 47% | +18 † |
| Ages 50–64 | 28% | 38% | +10 † |
| Ages 65+ | 19% | 24% | +5 |
| White | 21% | 32% | +11 † |
| Black | 34% | 51% | +17 † |
| Hispanic | 36% | 51% | +15 † |
| High school or less | 28% | 38% | +10 † |
| Some college | 26% | 40% | +14 † |
| College graduate | 26% | 42% | +16 † |
| Income under $50,000 | 29% | 41% | +12 † |
| $50,000 to under $75,000 | 19% | 40% | +21 † |
| $75,000 to under $100,000 | 31% | 38% | +7 |
| $100,000 or more | 26% | 40% | +14 † |
| Republican / lean Rep. | 28% | 39% | +11 † |
| Democrat / lean Dem. | 26% | 41% | +15 † |
| Conservative | 27% | 34% | +7 |
| Moderate | 26% | 45% | +19 † |
| Liberal | 29% | 40% | +11 † |
| Northeast | 29% | 33% | +4 |
| Midwest | 24% | 29% | +5 |
| South | 30% | 44% | +14 † |
| West | 24% | 47% | +23 † |
| Registered to vote | 28% | 40% | +12 † |
| Not registered | 24% | 38% | +14 † |
| Parent of a child under 18 | 31% | 47% | +16 † |
| Not a parent | 26% | 37% | +11 † |
Changes are the difference between the rounded percentages shown; significance is tested on unrounded values using each wave’s effective sample size.
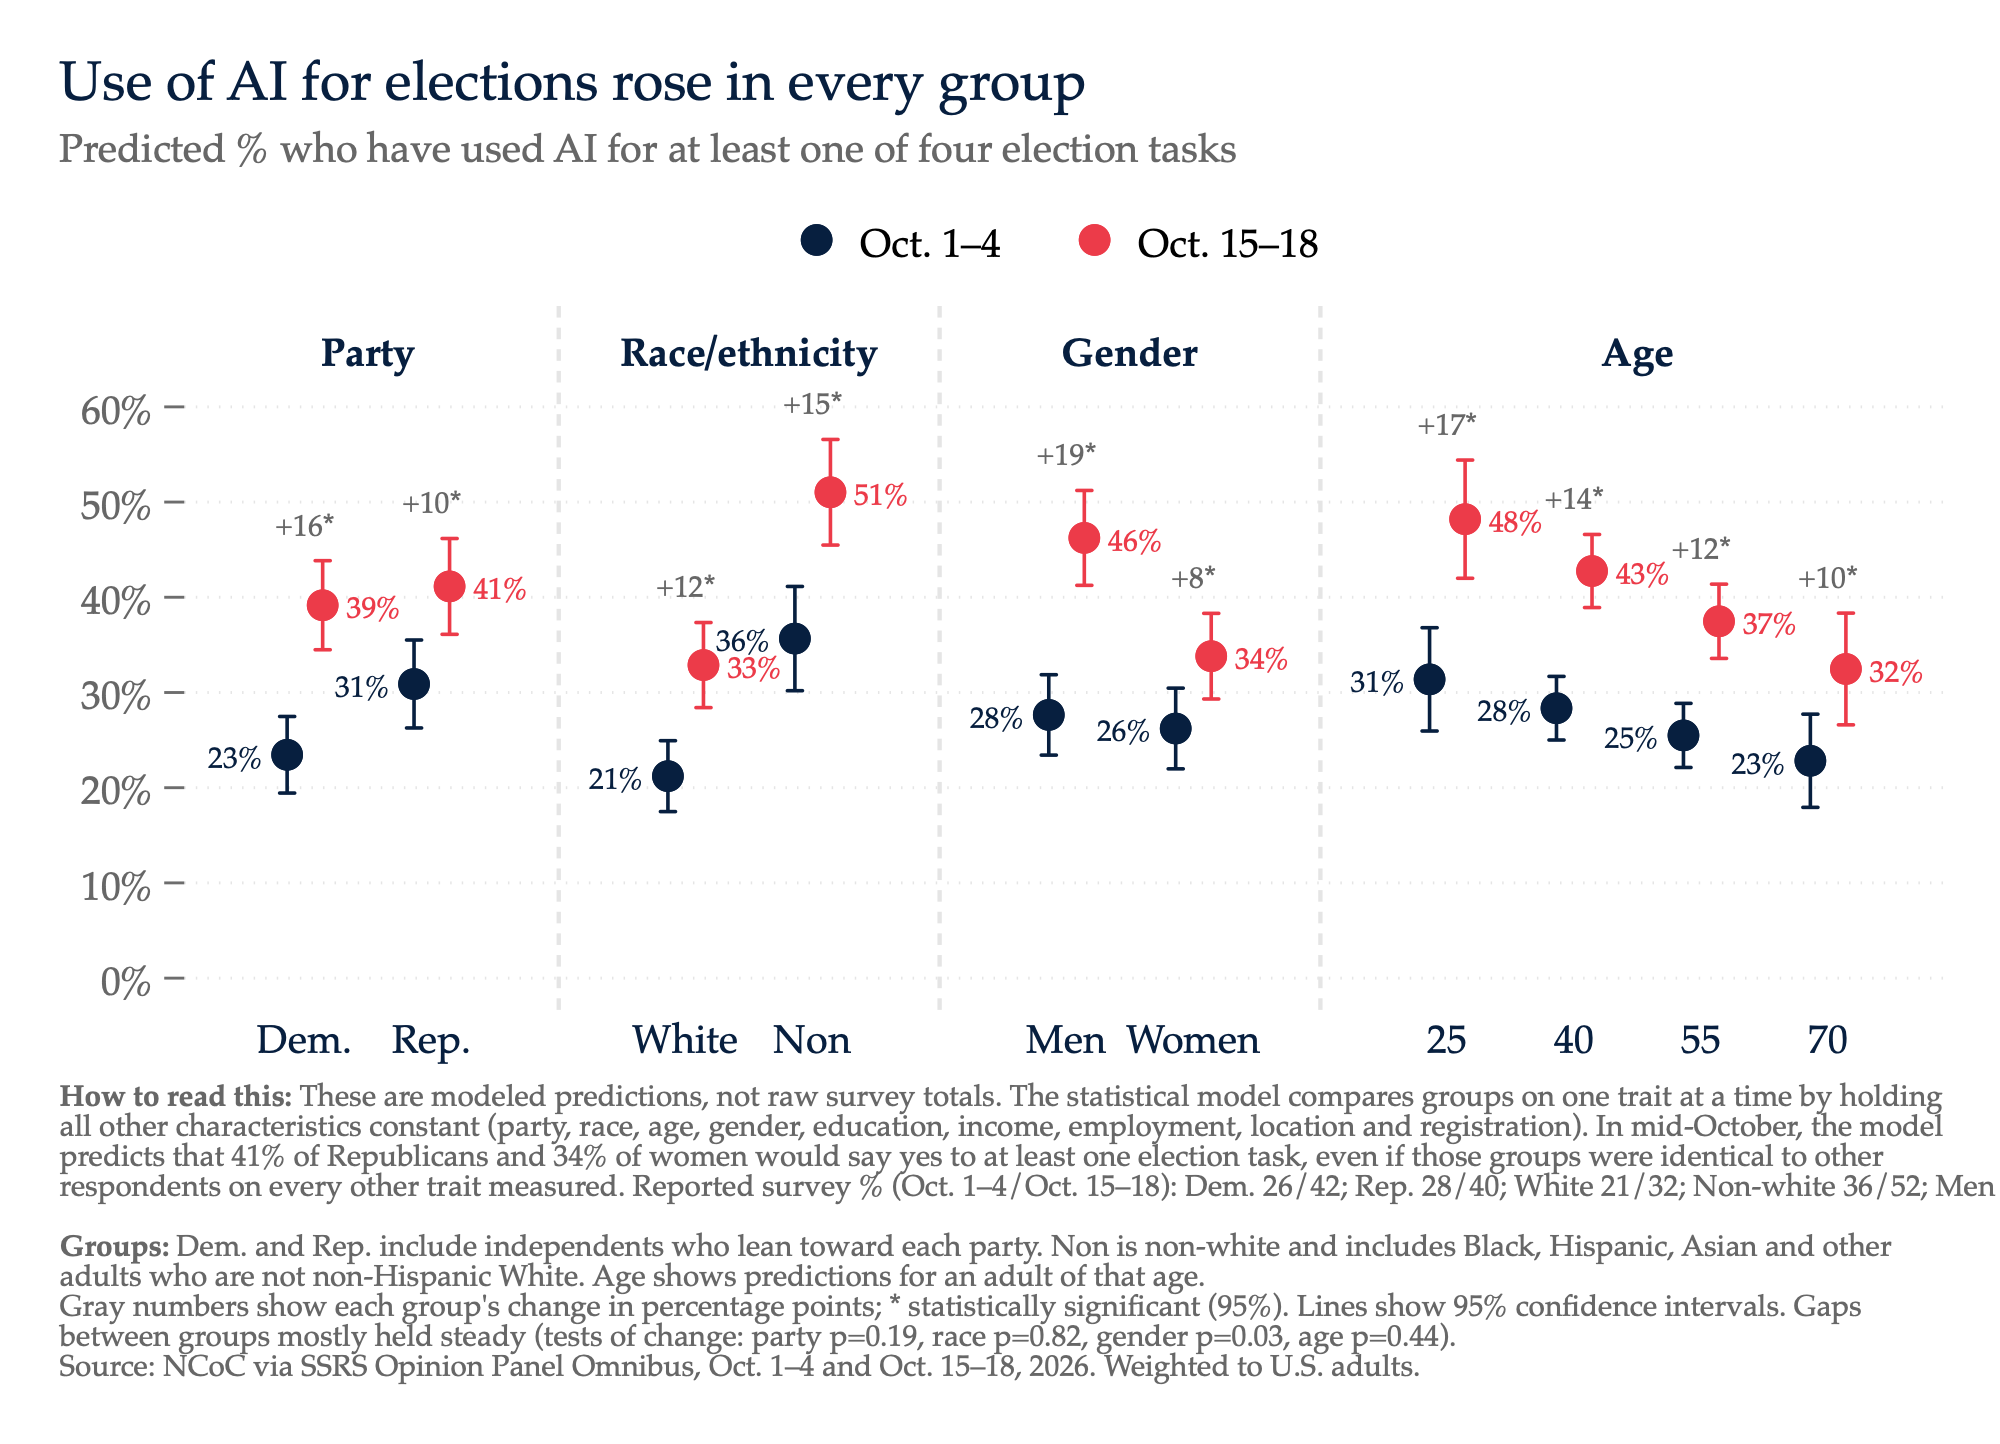
Three patterns are worth noting, with the caution above in mind. First, the increase was larger among men than among women: the gap between men and women was 3 points in early October, which is within sampling error, and 13 points in mid-October, which is not. The difference between the two increases is itself at the edge of statistical significance. Second, Black and Hispanic adults reported higher use than White adults in both waves. Third, there is no statistically detectable difference between Republicans and Democrats in either wave, and the two parties’ increases are similar. Regional and ideological differences in the size of the increase are suggestive but rest on smaller samples and should not be over-read.
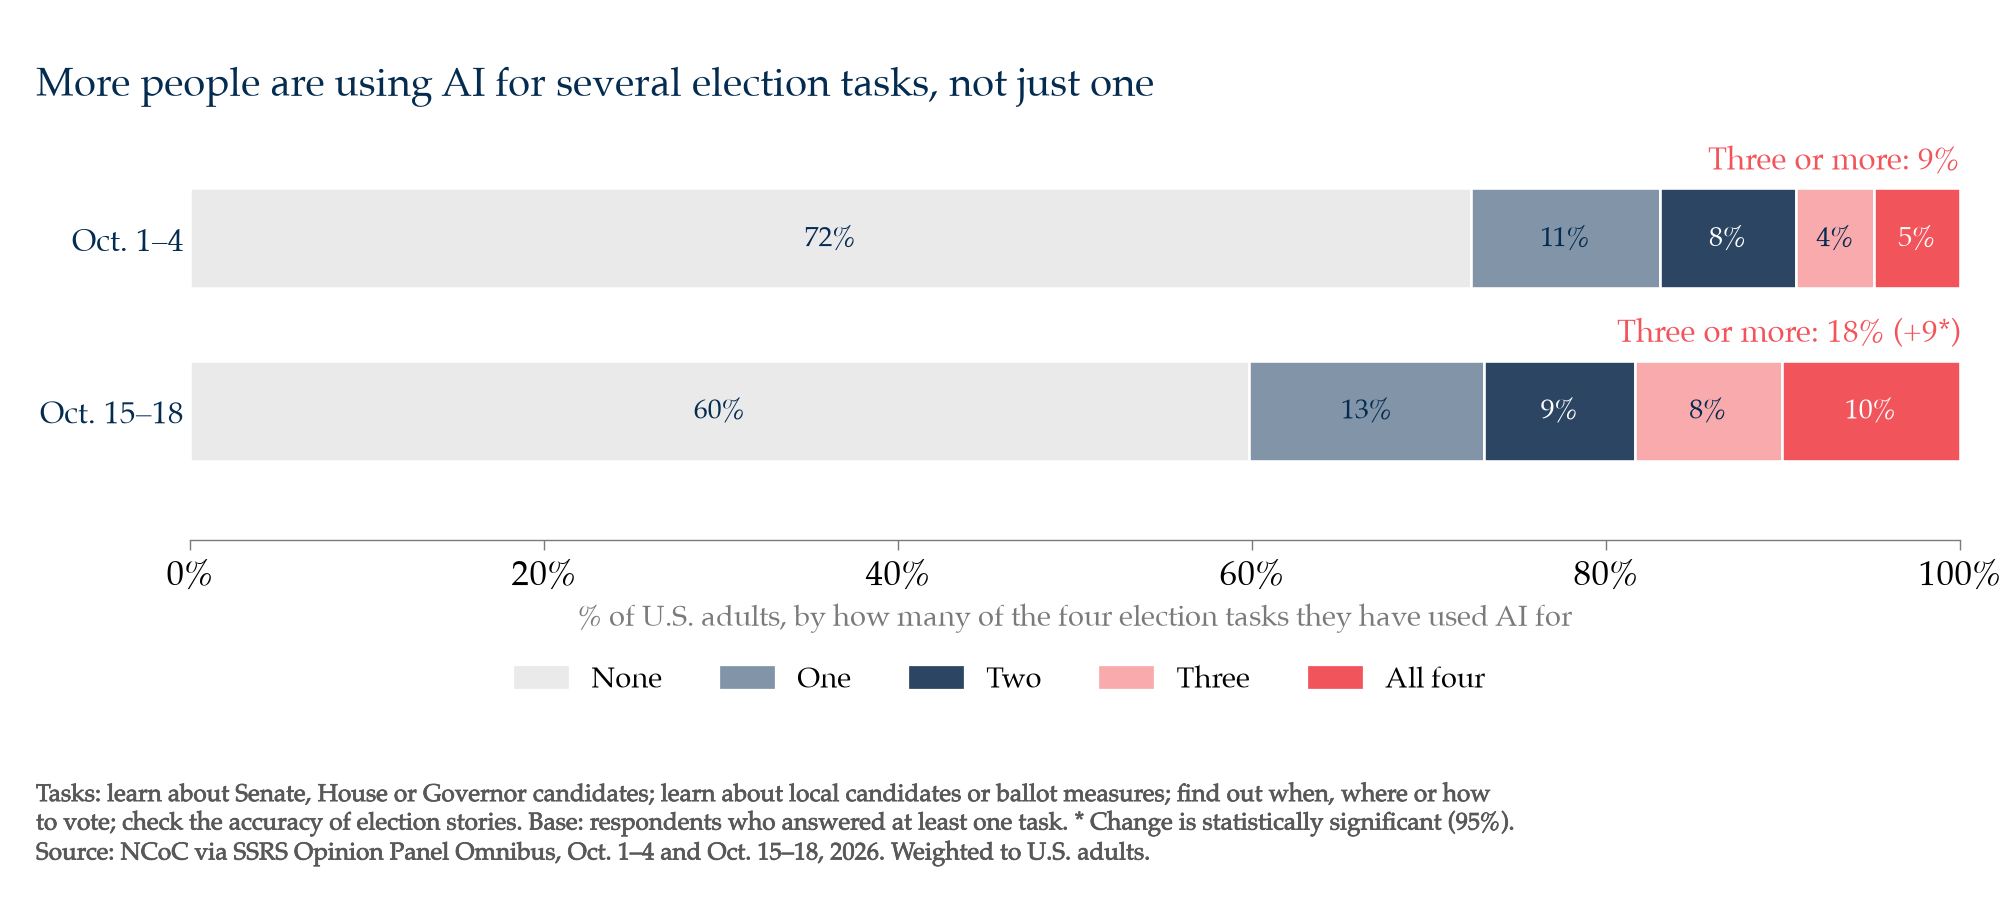
Number of tasks. Among election AI users, the average number of tasks reported rose from 2.1 to 2.4 of the four. The share of all adults reporting all four tasks rose from 5% to 10%, a statistically significant change. Because the question has no time limit, these figures describe how many tasks people have tried so far this election, not how often they use AI.
| Number of the four tasks (share of all adults) | Oct. 1–4 | Oct. 15–18 |
|---|---|---|
| One | 10% | 13% |
| Two | 8% | 8% |
| Three | 4% | 8% |
| All four | 5% | 10% |
Who uses AI for election tasks, holding other factors constant. Simple comparisons can mislead when groups overlap, for example because Republicans are disproportionately White and White adults use AI less. To separate these, NCoC fitted logistic regression models for each use item and for the “any of the four” and “three or more tasks” summaries, in each wave separately and pooled, with party, race and ethnicity, employment, age, education, income, gender and metro status entered together. This extends an analysis of the first wave by researchers at The Carter Center, whose results NCoC replicated. Odds ratios above 1 mean a group is more likely to report the use than its comparison group, other things equal; ‡ marks effects significant at the 95% level.
| Factor (comparison) | Candidates for Senate, House, Governor | Local candidates, ballot measures | When, where, how to vote | Check election stories | Any of the four |
|---|---|---|---|---|---|
| Non-white vs. White, early Oct. | 2.1 ‡ | 2.3 ‡ | 3.6 ‡ | 1.8 ‡ | 2.3 ‡ |
| Non-white vs. White, mid-Oct. | 1.7 ‡ | 2.1 ‡ | 1.7 ‡ | 2.0 ‡ | 2.3 ‡ |
| Republican vs. Democrat, early Oct. | 1.9 ‡ | 1.5 ‡ | 1.7 ‡ | 1.5 ‡ | 1.6 ‡ |
| Republican vs. Democrat, mid-Oct. | 1.0 | 1.0 | 1.0 | 1.1 | 1.1 |
| Employed vs. not, early Oct. | 1.5 | 1.2 | 1.2 | 0.9 | 1.0 |
| Employed vs. not, mid-Oct. | 1.5 ‡ | 1.5 ‡ | 1.3 | 1.3 | 1.2 |
| Women vs. men, early Oct. | 0.8 | 0.7 ‡ | 0.8 | 0.8 | 0.8 |
| Women vs. men, mid-Oct. | 0.7 ‡ | 0.6 ‡ | 0.7 ‡ | 0.8 | 0.6 ‡ |
| Ages 65+ vs. 30–49, early Oct. | 1.0 | 0.7 | 0.9 | 0.6 | 0.7 |
| Ages 65+ vs. 30–49, mid-Oct. | 0.7 | 0.6 ‡ | 0.7 | 0.6 ‡ | 0.5 ‡ |
| Metro vs. non-metro, early Oct. | 1.6 | 2.2 ‡ | 1.3 | 1.2 | 1.4 |
| Metro vs. non-metro, mid-Oct. | 1.0 | 1.3 | 1.1 | 1.0 | 1.1 |
Unweighted logistic regressions; “non-white” combines Black, Hispanic, Asian and other non-White respondents, who are too few to model separately. Party includes leaners; independents with no lean are included as a separate category. Education and income under $100,000 are in the models but not shown; neither is significant on any item in either wave. Full output is in the analysis file.
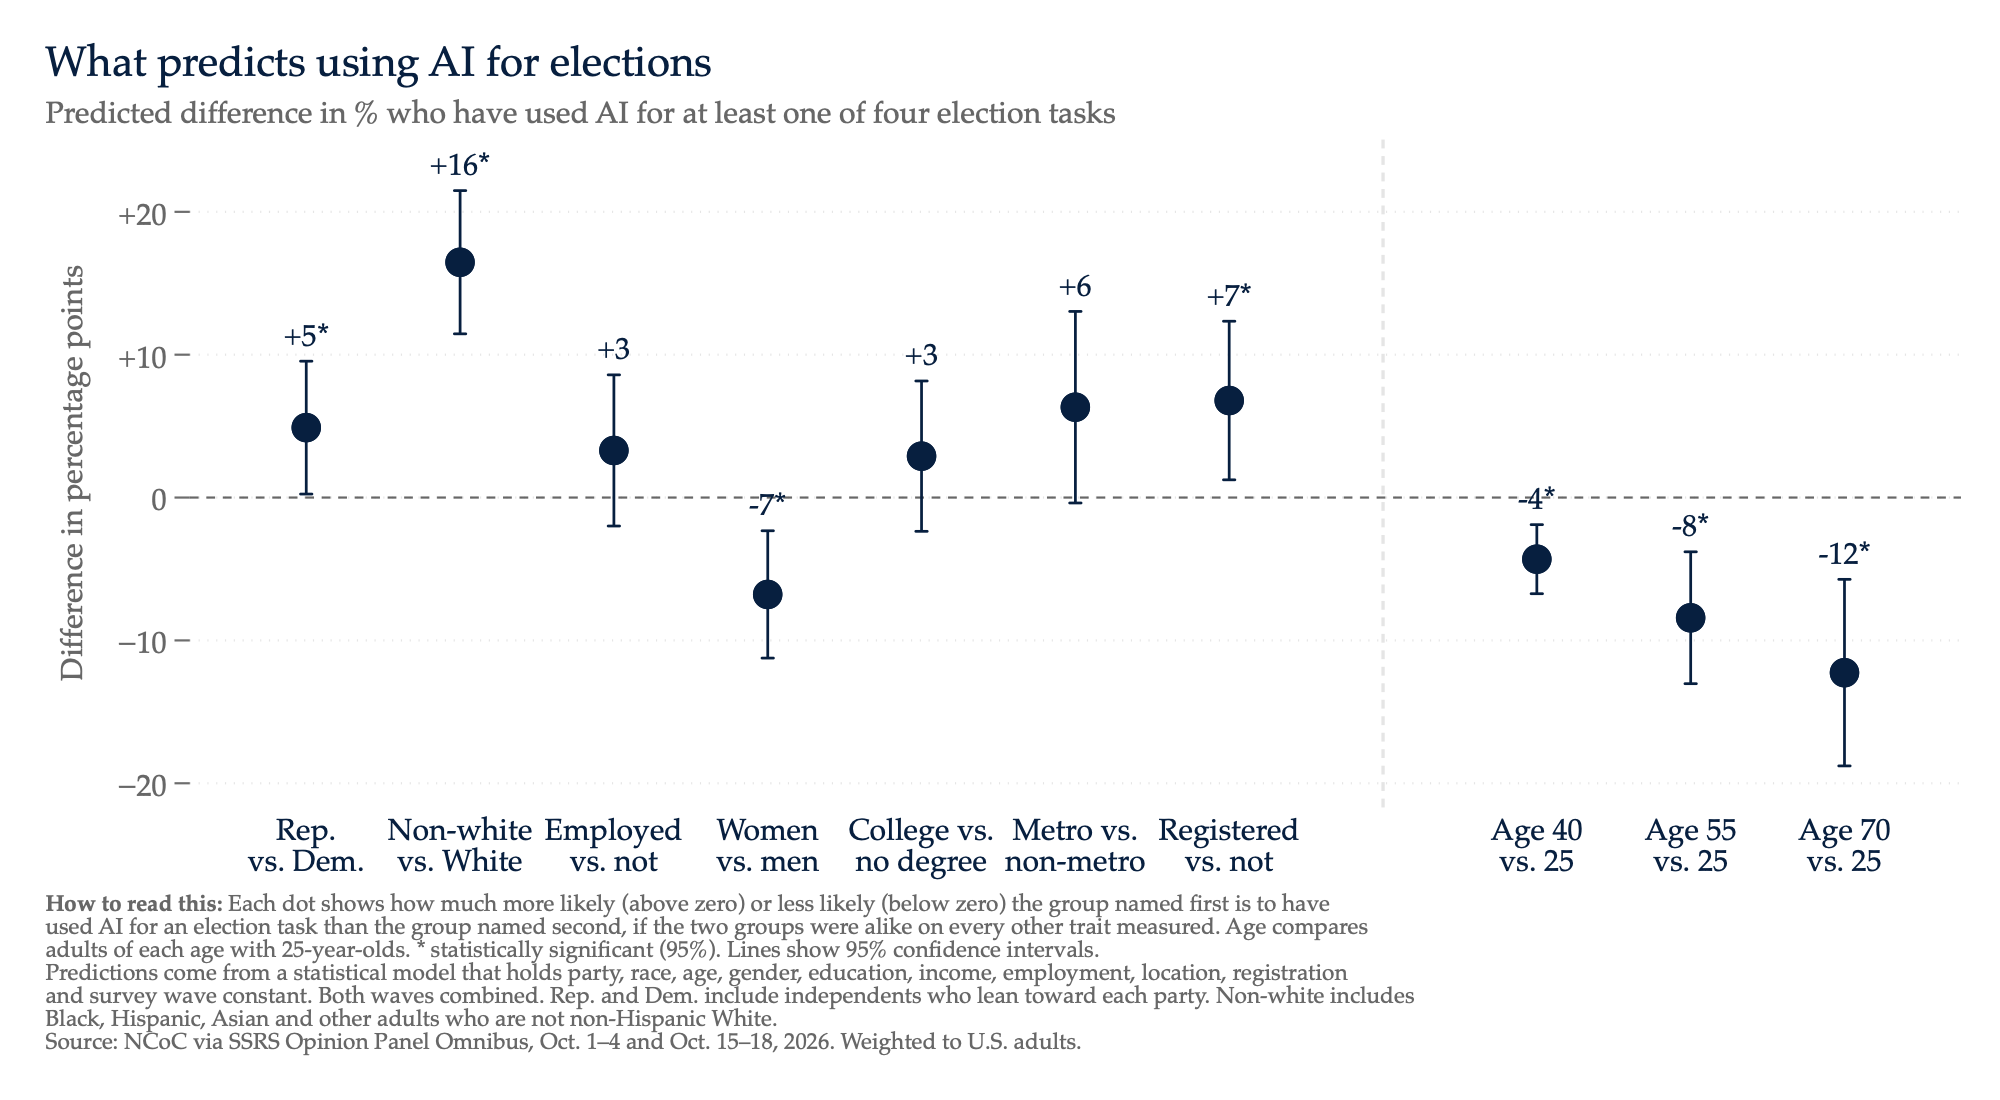
Five things follow from these models.
- Race and ethnicity is the one factor that predicts use on every task in both waves. Black, Hispanic and other non-white adults are roughly twice as likely as White adults to report each use, other things equal. The gap is widest in early October on voting logistics, where non-white adults were about three and a half times as likely as White adults to have asked AI when, where or how to vote (19% vs. 6%); by mid-October the gap on that item had narrowed (28% vs. 17%) as White adults caught up. Registration, identification and polling-place details are the questions where a wrong answer can cost someone their vote, and they are the questions non-white adults are most disproportionately putting to AI.
- The partisan pattern changed between waves. In early October, with other factors held constant, Republicans were more likely than Democrats to report every use (for example 19% vs. 12% on the major-race candidates item once adjusted). The raw gap was small because Republicans are disproportionately White, and White adults use AI less. In mid-October that adjusted gap is gone on every item: Democrats’ reported use rose faster, and the change in the party gap between waves is itself statistically significant on the candidates and voting-logistics items. The two-week headline, that use is similar across parties, holds in the raw figures in both waves and in the adjusted figures in mid-October.
- Employed adults are more likely users than those who are retired or not working, and this becomes significant in mid-October on the two candidate items (29% vs. 17% on the major-race item, unadjusted). This is not an age effect in disguise, since age is in the model.
- A gender gap and an age gradient appear in mid-October that were not there in early October. Adjusted for everything else, women were about 40% less likely than men to report any election use in mid-October, and adults 65 and older about half as likely as those 30 to 49. In early October neither difference was significant. General chatbot adoption skews young, so the absence of an age gradient in early October was a surprise; by mid-October election use had started to track the general adoption curve.
- Metro status and income matter only in early October, and only for local races. Early on, metro residents were about twice as likely as non-metro residents to have used AI for local candidates and ballot measures, and $100,000-plus households somewhat less likely. Neither holds in mid-October. One reading is that early adopters in metro areas were sorting through crowded down-ballot contests, and that the behaviour then spread; with only about 130 non-metro respondents per wave, this should be treated as suggestive.
Trust shows a different pattern. In the same models, trust in AI for voting logistics is higher among Republicans (significant in mid-October and pooled), higher-income households and college graduates, and lower among adults 65 and older. Race and ethnicity has only a weak relationship to trust once other factors are controlled. So the groups that rely most on AI for election logistics are not, in the main, the groups that trust it most.
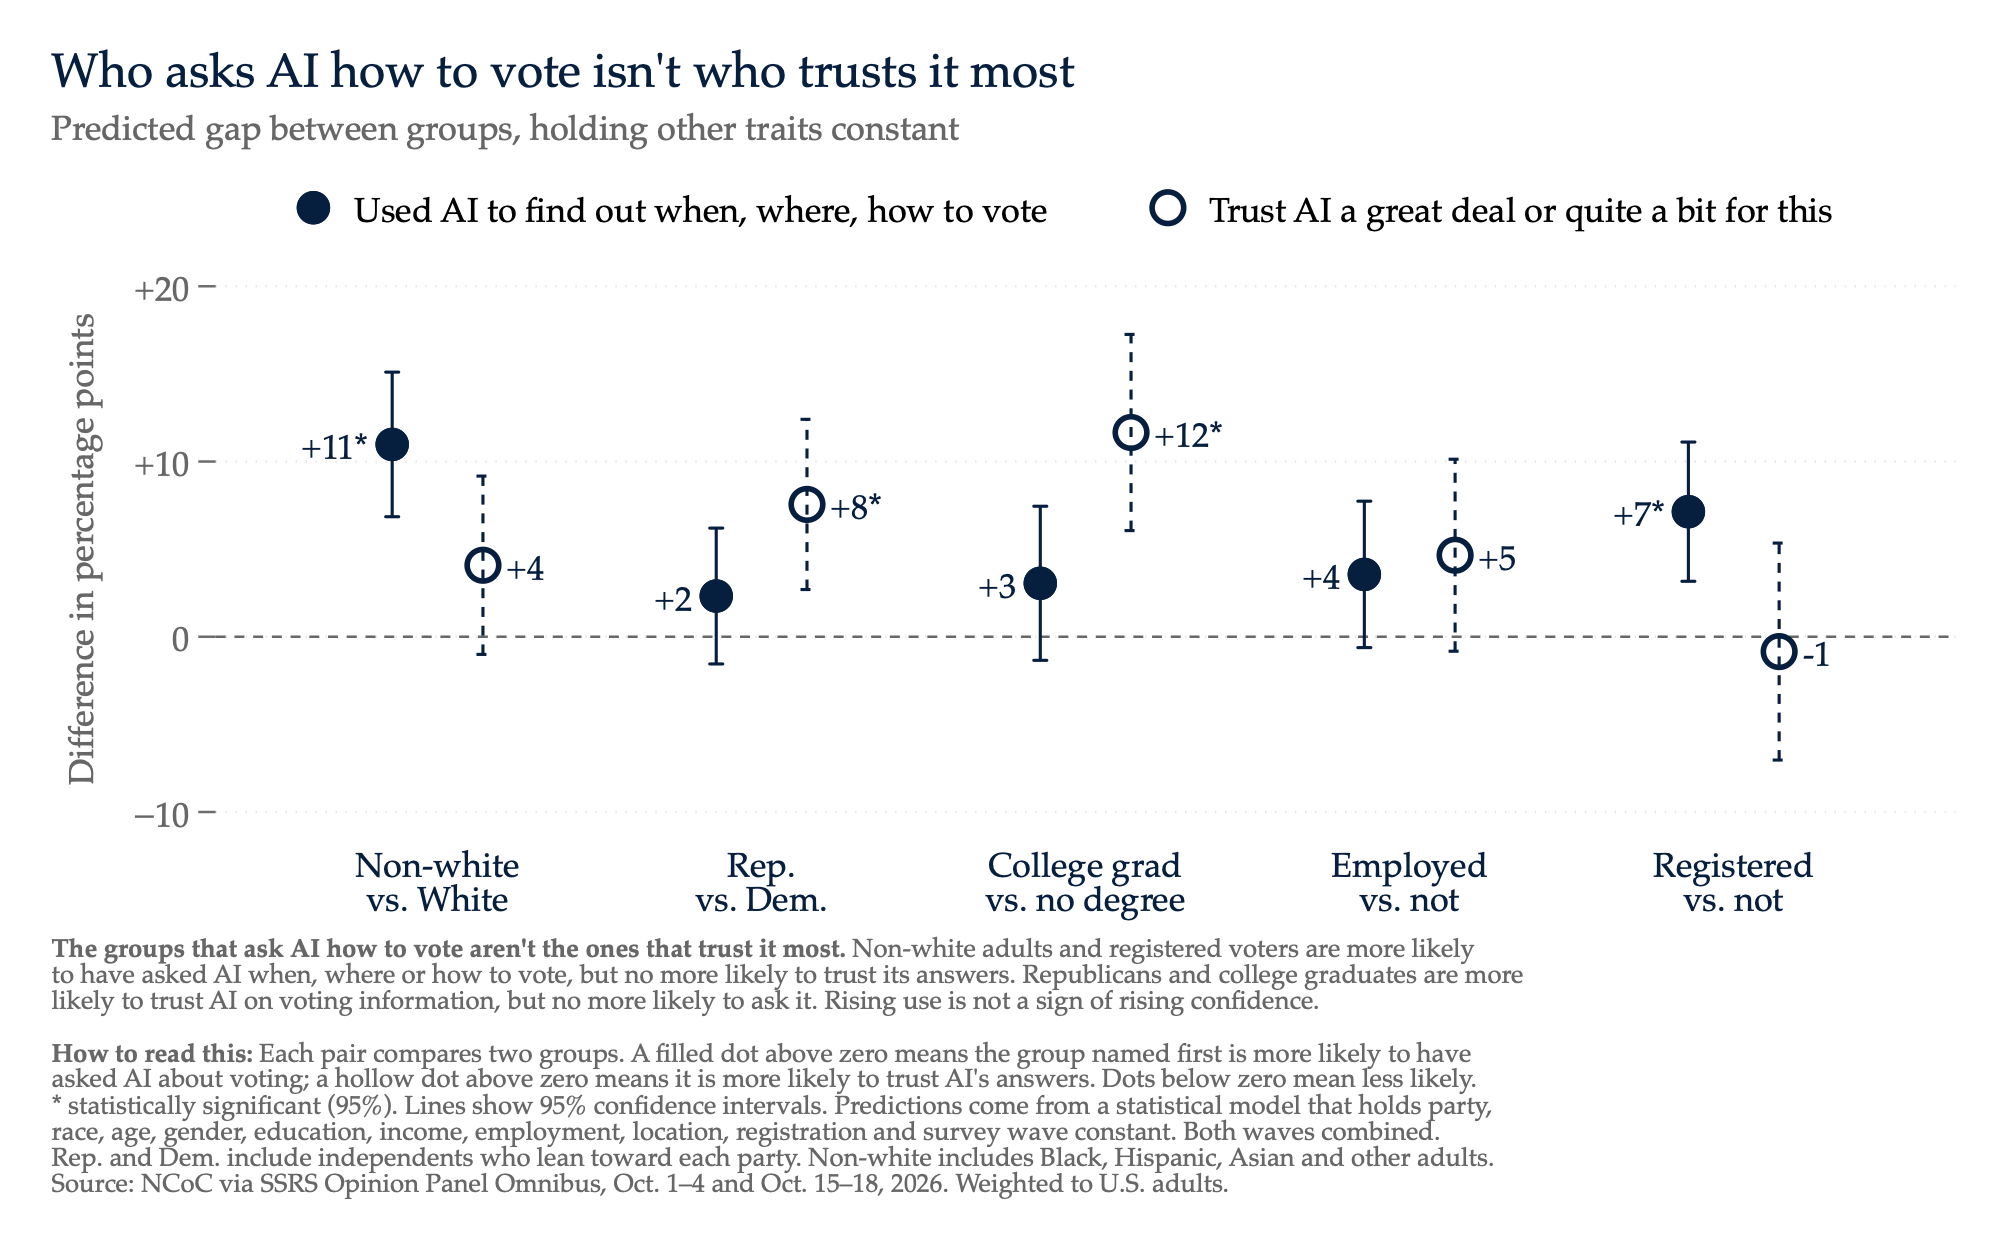
2. Trust in AI systems
All four trust items were asked of all respondents. In both waves a majority gave one of the two low-trust answers on every item.
| Trust AI systems “a great deal” or “quite a bit” to… | Oct. 1–4 | Oct. 15–18 | Change |
|---|---|---|---|
| Give accurate information on when, where, and how to vote | 35% | 40% | +5 |
| Give complete information about the election | 23% | 23% | 0 |
| Help local election officials automate routine election operations | 22% | 21% | −1 |
| Give unbiased information about political candidates | 20% | 22% | +2 |
| Trust AI systems “not at all” to… | Oct. 1–4 | Oct. 15–18 | Change |
|---|---|---|---|
| Give accurate information on when, where, and how to vote | 34% | 27% | −7 † |
| Give complete information about the election | 41% | 36% | −5 |
| Help local election officials automate routine election operations | 44% | 41% | −3 |
| Give unbiased information about political candidates | 42% | 39% | −3 |
† statistically significant at 95%. None of the “a great deal or quite a bit” changes is statistically significant; the logistics item (+5) is the closest.
Taken together, trust was essentially unchanged. The “not at all” share was lower in mid-October on every item, by 3 to 7 points, but only the logistics item is individually significant, and summary measures move by borderline amounts: the share who trust AI on at least one of the four items went from 43% to 46%, and the share who say “not at all” on all four went from 25% to 21%, neither a significant change. Logistics stands apart from the other three items in both waves.
Trust by group. Trust is higher among younger adults, college graduates and higher-income households, and lower among adults 65 and older. On the candidate, completeness and automation items, Black and Hispanic adults are more trusting than White adults; on voting logistics the three groups are similar. Republicans are more trusting than Democrats on two items in mid-October: automating election operations (26% vs. 17%, a significant difference) and voting logistics (44% vs. 37%, also significant). On unbiased candidate information (23% vs. 21%) and complete information (26% vs. 21%) the parties are not significantly different.
Share who trust AI “a great deal” or “quite a bit”, mid-October:
| Group | When, where, how to vote | Unbiased candidate information |
|---|---|---|
| All adults | 40% | 22% |
| Men | 44% | 24% |
| Women | 36% | 19% |
| Ages 18–29 | 48% | 30% |
| Ages 30–49 | 44% | 24% |
| Ages 50–64 | 36% | 18% |
| Ages 65+ | 31% | 15% |
| White | 38% | 17% |
| Black | 36% | 27% |
| Hispanic | 45% | 26% |
| High school or less | 33% | 20% |
| Some college | 36% | 20% |
| College graduate | 49% | 24% |
| Income under $50,000 | 35% | 22% |
| $50,000 to under $75,000 | 35% | 14% |
| $75,000 to under $100,000 | 38% | 17% |
| $100,000 or more | 50% | 26% |
| Republican / lean Rep. | 44% | 23% |
| Democrat / lean Dem. | 37% | 21% |
3. Use and trust together
Election AI users are more trusting than non-users on every item, but a majority of users still have little or no trust in AI for candidate information. This is an association between two answers from the same people; it does not show that using AI leads to trust or that trust leads to use.
| Mid-October: trust AI “a great deal” or “quite a bit” to… | Election AI users (n=411) | Non-users (n=593) |
|---|---|---|
| Give unbiased information about political candidates | 40% | 10% |
| Give accurate information on when, where, and how to vote | 57% | 29% |
| Give complete information about the election | 41% | 12% |
| Help local election officials automate routine operations | 36% | 10% |
Excludes 26 respondents who answered “don’t know” to at least one use item and “yes” to none.
Among mid-October users, 60% have little or no trust in AI to give unbiased candidate information (44% “only a little”, 16% “not at all”). In early October the figures were 61% (43% and 18%). Among those who said they had used AI specifically to learn about Senate, House or gubernatorial candidates, 58% have little or no trust in AI on candidate information, in both waves. Because the two waves interviewed different people, the data cannot say whether people who started using AI between the waves differ from earlier users; what they show is that the trust profile of the user population was the same in both waves.
4. In their own words
Respondents who said yes to any use item were asked: “Thinking about the most recent time you used AI for something related to the election, in your own words what did you ask and what did you do with the answer?” Every one of them gave some response (285 in early October, 411 in mid-October); 269 and 397 respectively gave a substantive description.
NCoC grouped the answers by theme using keyword matching followed by reading. A response can fall in more than one theme. These shares are approximate and unweighted, based on all respondents asked the question.
| Theme | Oct. 1–4 (n=285) | Oct. 15–18 (n=411) |
|---|---|---|
| Candidates: who is running, their positions, records, party | 36% | 36% |
| Logistics: when, where or how to vote; registration; ballots | 23% | 23% |
| Checking whether a claim or story was true | 8% | 7% |
| Results, polls, who is ahead | 4% | 3% |
| Ballot measures and propositions | 1% | 3% |
| General civics or history questions | 1% | 4% |
| Says they did not use AI, cannot remember, or gives no usable answer | 12% | 11% |
| Mentions checking the answer against another source | 6% | 7% |
Two things stand out. Candidate questions, the use on which the public expresses the least trust alongside completeness and automation, are the most common. And although 25% of adults said yes to the closed question about checking the accuracy of election stories, only 7–8% of users described a fact-check as their most recent use, which is a reminder that the open-ended question captures one occasion, not the full range of what people do. Mentions of political bias in the AI’s answers were rare and ran in both directions: a handful of respondents in each wave said the answers seemed slanted, one toward the left and one toward conservative candidates, while several others said the information they received was unbiased.
Illustrative answers, selected by NCoC and edited only for spelling and punctuation. Responses that named individual candidates or officials were excluded.
- “I asked AI to summarize two candidates’ platforms and compare them. I used the comparison to help decide which candidate I wanted to vote for.”
- “Asked about where the CA governor candidates stand on issues and break down where they are similar and where they contrast.”
- “I asked when early voting was taking place, and it gave me the dates and locations.”
- “Asked how to request an absentee ballot. I found out how to do it from the AI chat and requested my ballot.”
- “I wanted to verify if a political story was completely true or embellished. AI couldn’t tell me so I became confused.”
- “I asked general ballot and election info on various measures and props in CA, and I made sure to cross-check the answer using valid sources that I trust.”
- “I Googled some of the candidates and ballot initiatives and read the AI summary about them, but always scrolled down to find real sources.”
- “Pregunté si era verdad que tenía que cambiar mi registro porque cambió mi número de licencia y me dijo que sí y reemplacé mi registro.” (“I asked whether it was true that I had to change my registration because my license number changed; it said yes and I updated my registration.”)
How to read these numbers
- Self-report. The survey measures what respondents say they did. The open-ended follow-up shows that some respondents who answered “yes” did not use AI for elections as the question intended, and that some count AI-generated summaries in search results as “an AI chat program”. Self-reports can also miss use. The absolute levels are approximate; if misreporting was similar in both waves the change would be slightly smaller than measured, and if it differed the change could be biased in either direction.
- No time limit on the use question. “Have you used…” counts anyone who has done the task at any point this election. Some rise over a two-week period is expected on that basis alone.
- Margin of error. ±3.4 points for each full sample. A difference between the two waves needs to exceed roughly 4.8 points (for a figure near 50%) before it can be distinguished from sampling error. Subgroup margins are wider: about ±5 points for a group of 500, ±8 for 200, ±10 for 120. Many subgroup comparisons were run; a few nominally significant differences will be due to chance.
- “Don’t know”. The use items offered an explicit “don’t know” option; the trust items coded don’t know and refusals together. The “any of the four” summary counts a respondent as a user if they said yes to at least one item, and as a non-user otherwise.
- Independents. Only 1–2% of respondents neither identify with nor lean toward a party, too few to report separately.
- Two cross-sections, not a panel. The two waves are independent samples of the SSRS Opinion Panel, not the same people interviewed twice. The comparison is between two snapshots two weeks apart.
Toplines
All figures are weighted percentages of the full sample in each wave (n=1,033 and n=1,030) unless a different base is stated. Rows may not sum to 100 because of rounding. An asterisk (*) indicates a value under 0.5%; values from 0.5% to 0.99% are shown as 1. Rows labelled “Total” are computed from unrounded values and may differ by one point from the sum of the rounded rows shown. “No answer” combines “don’t know” and refusals where the questionnaire did not offer “don’t know” separately, and includes web respondents who skipped the question. Figures are as published in the SSRS topline document. Question wording is as given in the SSRS topline document.
NCOCAI1. Have you used an AI chat program (such as ChatGPT, Gemini, Claude, etc.) to do any of the following?
a. To learn about candidates for U.S. Senate, House of Representatives, or Governor in the 2026 November election as you were deciding how to vote
| Oct. 1–4 | Oct. 15–18 | |
|---|---|---|
| Yes | 14 | 25 |
| No | 82 | 73 |
| Don’t know | 4 | 2 |
| No answer | * | * |
b. To learn about candidates for local offices or ballot measures in the 2026 November election as you were deciding how to vote
| Oct. 1–4 | Oct. 15–18 | |
|---|---|---|
| Yes | 16 | 25 |
| No | 80 | 74 |
| Don’t know | 4 | 2 |
| No answer | 0 | 0 |
c. To find out when, where, or how to vote in the 2026 election – such as registration, voting location, mail-in ballot rules, ID rules, etc.
| Oct. 1–4 | Oct. 15–18 | |
|---|---|---|
| Yes | 11 | 21 |
| No | 84 | 76 |
| Don’t know | 4 | 3 |
| No answer | 0 | * |
d. To check the accuracy of stories about the election you encounter elsewhere
| Oct. 1–4 | Oct. 15–18 | |
|---|---|---|
| Yes | 16 | 25 |
| No | 79 | 73 |
| Don’t know | 5 | 2 |
| No answer | * | 0 |
Summary of NCOCAI1 a–d
| Oct. 1–4 | Oct. 15–18 | |
|---|---|---|
| Yes to at least one | 28 | 40 |
| No to all four | 67 | 58 |
| No “yes”; at least one “don’t know” or no answer | 6 | 2 |
NCOCAI2. How much do you trust “AI” systems, if at all, to do the following?
a. Give you unbiased information about political candidates
| Oct. 1–4 | Oct. 15–18 | |
|---|---|---|
| Total: A great deal / Quite a bit | 20 | 22 |
| A great deal | 4 | 5 |
| Quite a bit | 16 | 17 |
| Total: Only a little / Not at all | 80 | 78 |
| Only a little | 38 | 39 |
| Not at all | 42 | 39 |
| No answer | * | 0 |
b. Help local election officials automate routine election operations
| Oct. 1–4 | Oct. 15–18 | |
|---|---|---|
| Total: A great deal / Quite a bit | 22 | 21 |
| A great deal | 4 | 6 |
| Quite a bit | 18 | 15 |
| Total: Only a little / Not at all | 78 | 79 |
| Only a little | 34 | 39 |
| Not at all | 44 | 41 |
| No answer | * | * |
c. Give you accurate information on when, where, and how to vote
| Oct. 1–4 | Oct. 15–18 | |
|---|---|---|
| Total: A great deal / Quite a bit | 35 | 40 |
| A great deal | 9 | 11 |
| Quite a bit | 27 | 29 |
| Total: Only a little / Not at all | 64 | 60 |
| Only a little | 30 | 33 |
| Not at all | 34 | 27 |
| No answer | * | 0 |
d. Give you complete information about the election, without leaving out important facts
| Oct. 1–4 | Oct. 15–18 | |
|---|---|---|
| Total: A great deal / Quite a bit | 23 | 23 |
| A great deal | 4 | 6 |
| Quite a bit | 19 | 18 |
| Total: Only a little / Not at all | 77 | 77 |
| Only a little | 37 | 40 |
| Not at all | 41 | 36 |
| No answer | * | 0 |
Summary of NCOCAI2 a–d (NCoC computation)
| Oct. 1–4 | Oct. 15–18 | |
|---|---|---|
| A great deal / quite a bit on at least one item | 43 | 46 |
| Not at all on all four items | 25 | 21 |
NCOCAI3. Thinking about the most recent time you used AI for something related to the election, in your own words what did you ask and what did you do with the answer?
Open-ended. Asked of respondents who answered yes to any NCOCAI1 item (n=285 in early October, n=411 in mid-October). Themes are reported in section 4 of the findings.
Methodology
SSRS methodology statement (reproduced verbatim)
Wave 1
Wave 1 for this study was conducted by SSRS on its Opinion Panel Omnibus platform. The SSRS Opinion Panel Omnibus is a national, twice-per-month, probability-based survey. Data collection was conducted from October 1 – October 4, 2026 among a sample of 1,033 respondents. The survey was conducted via web (n=1,003) and telephone (n=30) and administered in English (n=1,007) and Spanish (n=26). The margin of error for total respondents is +/-3.4 percentage points at the 95% confidence level. All SSRS Opinion Panel Omnibus data are weighted to represent the target population of U.S. adults ages 18 or older.
Wave 2
Wave 2 for this study was conducted by SSRS on its Opinion Panel Omnibus platform. The SSRS Opinion Panel Omnibus is a national, twice-per-month, probability-based survey. Data collection was conducted from October 15 – October 18, 2026 among a sample of 1,030 respondents. The survey was conducted via web (n=1,000) and telephone (n=30) and administered in English (n=1,004) and Spanish (n=26). The margin of error for total respondents is +/-3.4 percentage points at the 95% confidence level. All SSRS Opinion Panel Omnibus data are weighted to represent the target population of U.S. adults ages 18 or older.
SSRS notes for reading the topline
Percentages may not always add up to 100 percent due to rounding. NET rows are calculated from unrounded values and may differ by one point from the sum of the rounded rows shown. Values less than 1 percent are indicated by an asterisk (*). No answer includes those who said ‘Don’t know’ or refused to answer the question on the phone and those who skipped the question on the web.
Survey design and disclosure
- Sponsor. The questions were commissioned by the National Conference on Citizenship in collaboration with researchers at The Carter Center. The NCoC items (NCOCAI1–3) were written by NCoC with The Carter Center researchers.
- Question order. SSRS rotates the order of client question sets within each omnibus to reduce order effects.
- Skip logic. NCOCAI3 was asked only of respondents who answered yes to at least one NCOCAI1 item. All other items were asked of everyone.
- Weighting and response rates. SSRS weighted the data to benchmarks from the 2025 Current Population Survey (sex, age, education, race, Hispanic nativity, region, home tenure, household size), Claritas Pop-Facts 2026 (population density), Pew Research Center’s NPORS (religion, internet use, party identification) and CPS supplements (civic engagement, voter registration). Panelists are recruited by address-based sampling, supplemented by prepaid-cell RDD. The survey completion rate was 54% in wave 1 and 55% in wave 2; the cumulative response rate, which accounts for panel recruitment, was 2% in each wave.
- Weighting. NCoC used the SSRS-supplied weight without modification. Weights range from 0.42 to 2.68 in wave 1 and 0.37 to 2.63 in wave 2.
- Design effect and effective sample size. The unequal weights give a design effect of about 1.24 in wave 1 and 1.26 in wave 2, and Kish effective sample sizes of 836 and 819. The ±3.4-point margin of error reported by SSRS already reflects this design effect. Approximate margins for subgroups, allowing for the same design effect: ±5 points for 500 respondents, ±8 for 200, ±10 for 120.
NCoC analysis notes
- Source. All figures were computed by NCoC from the respondent-level SSRS datafile (merged waves, 2,063 records) using the SSRS weight variable. Weighted counts match the SSRS banner book on every cell NCoC checked.
- Figures of record. Topline cells and the “any of the four” summary are as published by SSRS. Changes shown in tables are the difference between the rounded percentages displayed; significance is tested on the unrounded values.
- Significance. Differences between waves, and between groups, are tested with a two-proportion z-test using effective sample sizes. “Statistically significant” means a result that would occur by chance less than 5% of the time (|z| ≥ 1.96). No adjustment is made for multiple comparisons; the number of comparisons shown is noted where it matters.
- Subgroups. Party includes leaners. Education collapses “less than high school” with “high school graduate”. Subgroups are reported only where both waves have at least 100 unweighted respondents; rows below that threshold in the product tables are marked.
- Open-ended coding. Themes in NCOCAI3 were identified by keyword matching on the verbatim text, followed by reading. A response can fall in more than one theme. Coding was done by NCoC and has not been independently replicated; the shares are indicative rather than a formal content analysis.
- Regression models. Logistic regressions were fitted without weights to each use item, the any-of-four and three-or-more summaries, and the voting-logistics trust item, separately by wave and pooled with a wave indicator and wave-by-group interactions. Predictors: party (Republican or lean, Democrat or lean, no lean), race and ethnicity (White non-Hispanic vs. all others), employment (employed full or part time vs. not), age (four groups), education (three groups), household income $100,000 or more, gender, and metro status. Weighted versions of the models give the same pattern of significant effects. The wave 1 models replicate an independent analysis by researchers at The Carter Center.
- AI assistance. NCoC staff used Claude, an AI assistant made by Anthropic, to help write the analysis code, classify open-ended responses by keyword, fit the regression models, and draft the text of this report. Claude is one of the products asked about in the survey. All figures were computed from the SSRS data and reviewed by NCoC staff, who are responsible for the analysis and its conclusions. Anthropic had no role in the survey or this report and did not review it.
How to cite
National Conference on Citizenship and The Carter Center. (2026). Americans, AI, and the 2026 Midterms: How many people are turning to AI chat programs for election information, and how much they trust it. Washington, DC: NCoC. https://ncoc.org/ai-midterms-report/
Contact: Cameron Hickey, National Conference on Citizenship, cameron@ncoc.org.
Data availability: The full question wording and toplines for both waves are included in this report. Additional crosstabulations are available from NCoC on request. The respondent-level data were collected by SSRS and provided to NCoC; they are not publicly released.